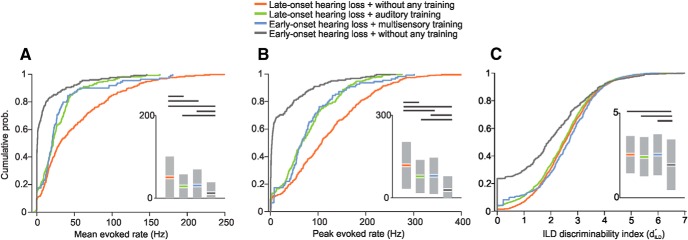
Figure 8.

Cumulative probability functions showing the relative magnitude of the stimulus-evoked responses of A1 neurons, grouped by age of onset of hearing loss and training history in animals with BiCIs. A, Mean sound-evoked firing rates. B, Peak sound-evoked firing rates. C, ILD discriminability index computed from rate-level functions. Insets, Modified box-plots showing the means and 95% confidence intervals of each spike rate measure, grouped in the same fashion as the probability functions. The probability functions and bars indicating that the means have been color-coded to identify the different groups. The horizontal lines indicate significant intergroup differences, as revealed by Tukey HSD tests for post-ANOVA pairwise comparisons.
