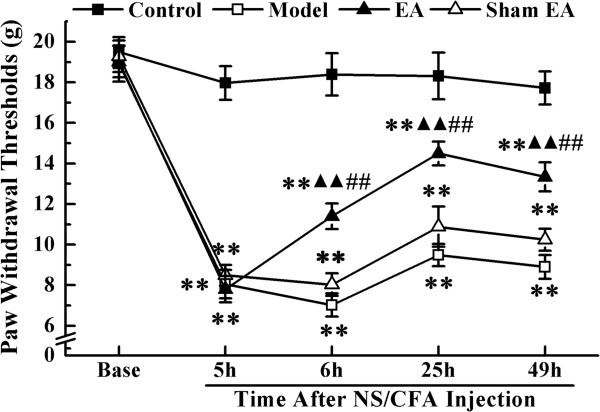
Figure 1.

The paw withdrawal thresholds (PWTs) of rats in each group at different time-points. PWTs were measured at pre-injection, 5, 6, 25 and 49 h after NS/CFA injections. Values represent mean ± SEM; n = 10 per group for each time point. **P < 0.01 versus control group at the corresponding time point. ▲▲ P < 0.01 versus model group at the corresponding time point. ## P < 0.01 versus sham EA group at the corresponding time point.
