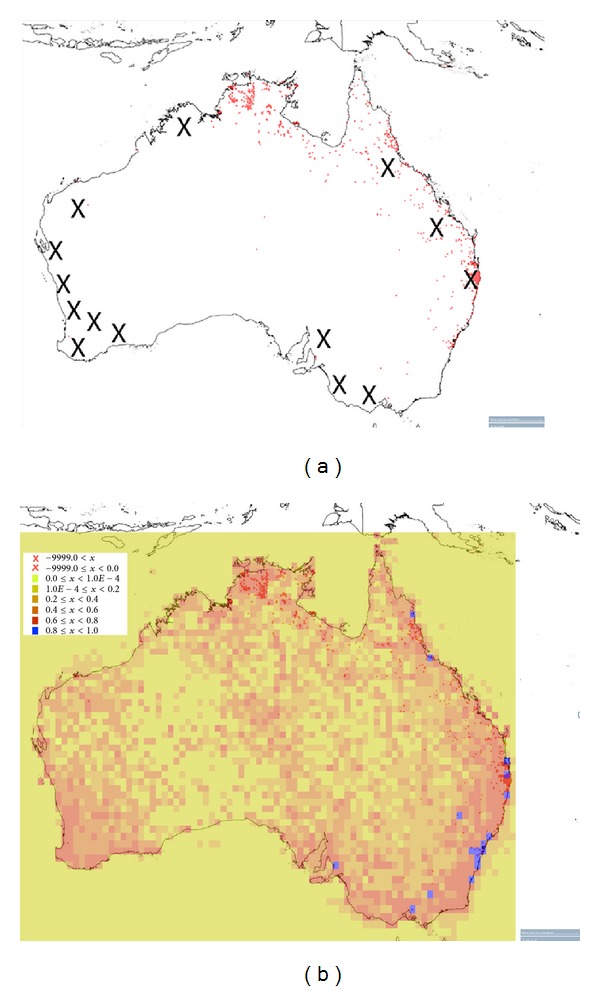
Figure 2.

A map of the current cane toad distribution (6,349 total records marked with red dots (a)) and 14 of the 15 biodiversity hotspots (×, (a)). The cane toad population data is overlaid with species richness data; blue indicates higher and yellow lower levels of species diversity, respectively (b). Maps created from [33].
