
. 2014 Jul 21;2014:135049. doi: 10.1155/2014/135049
Copyright © 2014 Beppe Micallef-Trigona.
This is an open access article distributed under the Creative Commons Attribution License, which permits unrestricted use, distribution, and reproduction in any medium, provided the original work is properly cited.
Figure 2.
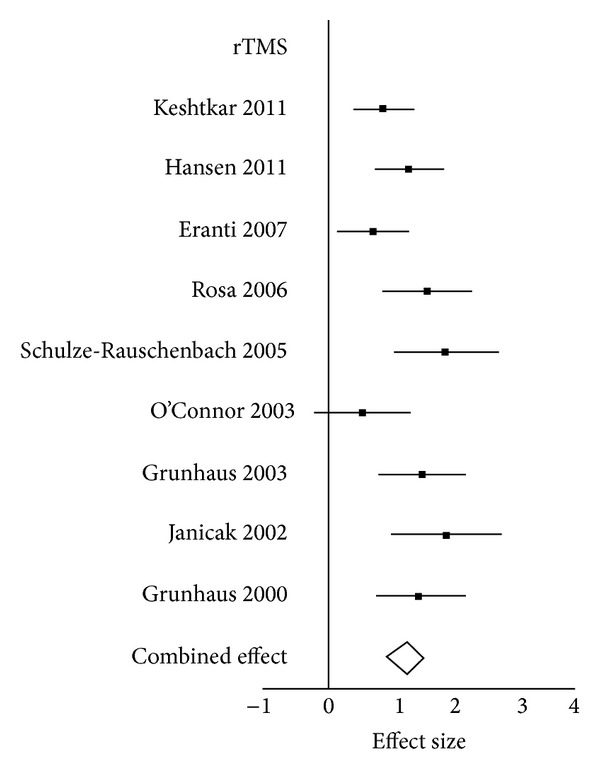
Forrest Plot rTMS.