
Figure 8.
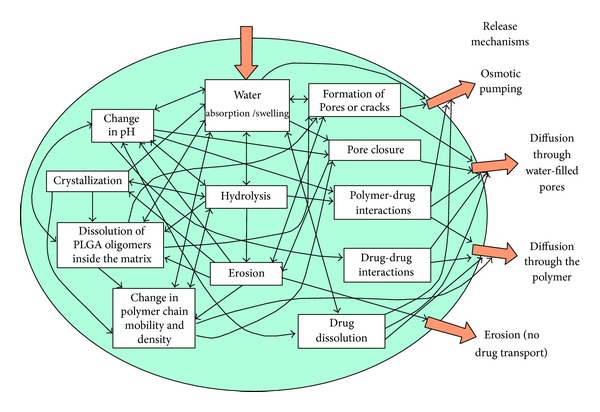
The complex picture of physicochemical processes taking place within PLGA matrices, leading to drug release. The influence of processes on drug release and on other processes is illustrated by arrows. Note that some arrows point in both directions [120] (reproduced with permission from Elsevier B.V. Ltd., 2011).