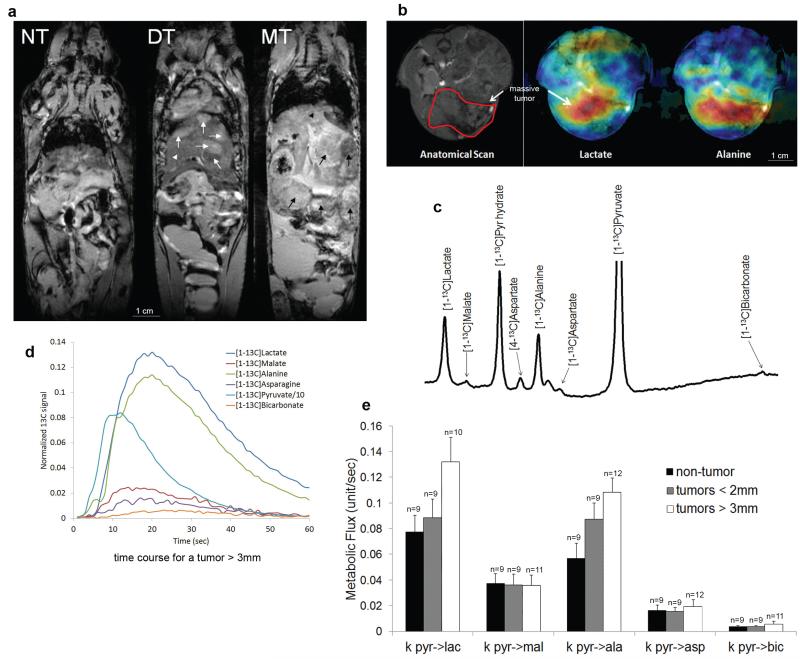
Figure 6. Quantitative changes in pyruvate metabolism can be detected by hyperpolarized carbon-13 magnetic resonance spectroscopy.
in vivo. a, T2-weighted MRI illustrates the development of HCC at different stages in Liver-SB/HBsAg animals. The anatomy appears normal in the pre-tumor stage (NT), at 2-5 months of age. However, at approximately 8 months of age, tumors (white arrows) began to appear within the normal liver (white arrow head). This is referred to as the developing tumor (DT) stage. Massive tumors (MT) were detected by MRI approximately two months later (black arrows). b, Live in vivo imaging provided the mapping of lactate and alanine production in HCC after hyperpolarized pyruvate injection (blue -> green -> yellow -> red represent amounts of molecules lowest to largest). c, Representation of the in vivo measured hyperpolarized carbon-13 spectra in the liver. Metabolites that were detected include [1-13C]lactate (183.0 ppm), [1-13C]malate (181.5 ppm), [1-13C]pyruvate hydrate (179.1 ppm), [4-13C]aspartate (177.8 ppm), [1-13C]alanine (176.4 ppm), [4-13C]oxaloacetate (175.6 ppm), [1-13C]aspartate (175.0 ppm), [1-13C]pyruvate (170.8 ppm) and [1-13C]bicarbonate (160.8 ppm). The pyruvate peak was truncated to better illustrate the downstream metabolite peaks. d, Representative time course depicting the simultaneous production of downstream metabolites upon infusion of hyperpolarized [1-13C]pyruvate in a mouse bearing a large liver tumor. e, Quantitative changes in pyruvate metabolism can be detected by hyperpolarized carbon-13 magnetic resonance spectroscopy in live mice in vivo. Rate of exchange of 13C label from [1-13C]pyruvate (pyr) to [[1-13C]lactate (lac), [1-13C]malate (mal), [1-13C]alanine (ala), [1-13C]aspartate (asp), and [1-13C]bicarbonate (bic) after [1-13C]pyruvate infusion into mice at different tumor development stages. ANOVA tests were performed for each metabolic flux result. At the FDR-corrected significance level of 0.05, no differences between group means were found. However, explicitly testing for a trend by computing Spearman correlation showed that the metabolic flux pyr->ala significantly increased with tumor size (rho = 0.51; FDR-corrected p=0.022). Although a strong trend was also observed for the metabolic flux pyr->lac, this did not reach statistical significance (rho = 0.43; FDR-corrected p = 0.052). The number of animals in groups is indicated above each bar. Error bars represent the standard error of the mean (SEM).

