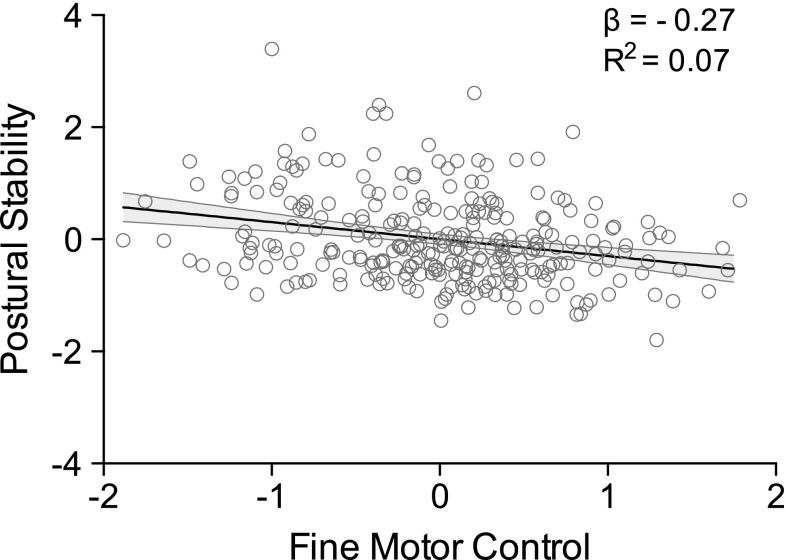
Fig. 3.
Simple linear regression analysis indicates that gross motor aptitude could significantly predict fine motor control performance (b = −0.24, β = −0.27, t(277) = 4.62, p < 0.001), with the predictor variable able to explain 7 % of the total variation in fine motor control performance (R 2 = 0.07, F(1, 276) = 21.37, p < 0.001). Shaded area represents 95 % confidence interval of the regression line. Abscissa shows standardised fine motor control performance and ordinate represents standardised scores on the composite measure of postural stability

