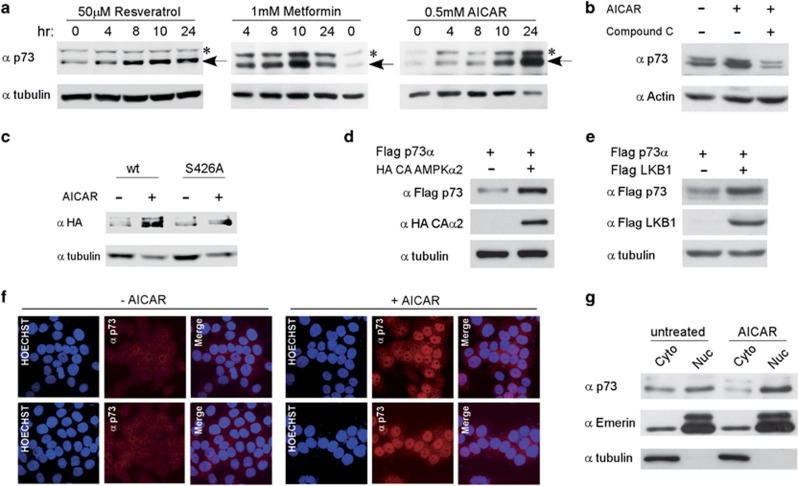
Figure 2.
Activation of AMPK results in p73 accumulation and localization in the nucleus. (a) HCT116 cells were treated with the indicated drugs for different time points. Cells were lysed together and subjected to immunoblot analysis for endogenous p73 protein. Asterisks mark nonspecific cross-reacting bands. (b) AMPK inhibitor, compound C (10 μM), was added an hour before the addition of 0.5 mM AICAR. Cells were lysed and analyzed by immunoblotting after 24 h. (c) HCT116 cells transiently expressing either HA p73α (wt) or HA p73α S426A were treated with 0.5 mM AICAR for 24 h, and analyzed by immunoblotting. (d) Co-expression of Flag-tagged p73α with HA-tagged constitutively active AMPKα2 in HEK-293 cells. Cell lysates were analyzed by immunoblotting 24 h post transfection. (e) Co-expression of Flag-tagged p73α with Flag-tagged LKB1 in HEK-293 cells. Cell lysates were analyzed by immunoblotting 24 h post transfection. (f) Immunofluorescence analysis of endogenous p73 protein in HCT116 cells that were either untreated (−AICAR), or treated with 0.5 mM AICAR for 24 h. Rhodamine red-X-conjugated secondary antibody was used to detect the primary anti-p73 antibody (red channel), and Hoechst was used to visualize the nuclei (blue channel). The cells were visualized by confocal laser microscope, and representative optical fields are shown. (g) HCT116 cells were either untreated or incubated with 0.5 mM AICAR for 24 h followed by subcellular fractionation. Equivalent cell lysates from cytoplasmic and nuclear fractions were analyzed by western blotting using the indicated antibodies. Tubulin and emerin were analyzed to indicate the purity of the cytoplasmic and nuclear fractions, respectively

