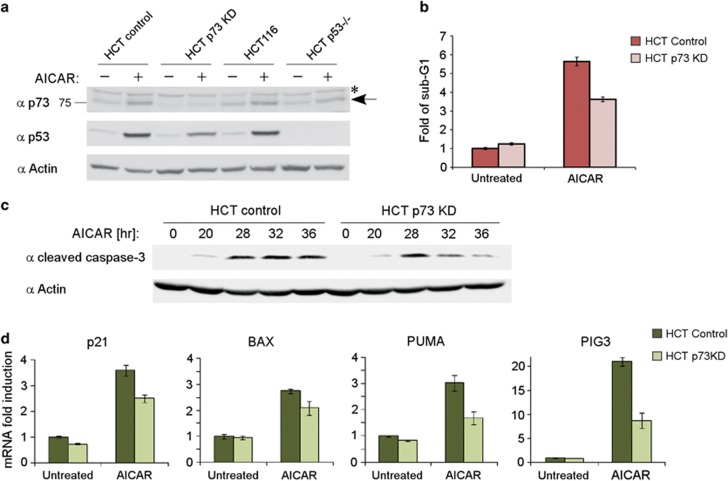
Figure 4.
p73 supports the apoptotic response induced by AMPK activation. (a) HCT116, HCT p53−/−, and HCT116 cells stably expressing a non-silencing cassette (control) or an shRNA directed against p73 (p73 KD) were either untreated or incubated with 0.5 mM AICAR for 24 h. Lysates were then analyzed by immunoblotting. An asterisk marks a nonspecific cross-reacting band, and an arrow points to the endogenous p73 band. (b) Apoptotic sub-G1 population analysis by flow cytometry. HCT116 cells stably expressing a non-silencing cassette (control) or an shRNA directed against p73 (p73 KD) were either untreated or incubated with 0.5 mM AICAR for 25 h. Represented is fold induction of the sub-G1 population over the untreated HCT control cells. Data are represented as mean±S.D (n=3). (c) HCT116 cells stably expressing a non-silencing cassette (control) or an shRNA directed against p73 (p73 KD) were incubated with 0.5 mM AICAR and collected at different time points, as indicated. Cell lysates were analyzed by immunoblotting, and actin served as a loading control. (d) Cells were treated the same as in (b). The expression levels of the indicated mRNA were analyzed by real-time PCR. Data are represented as mean±S.D. (n=3)

