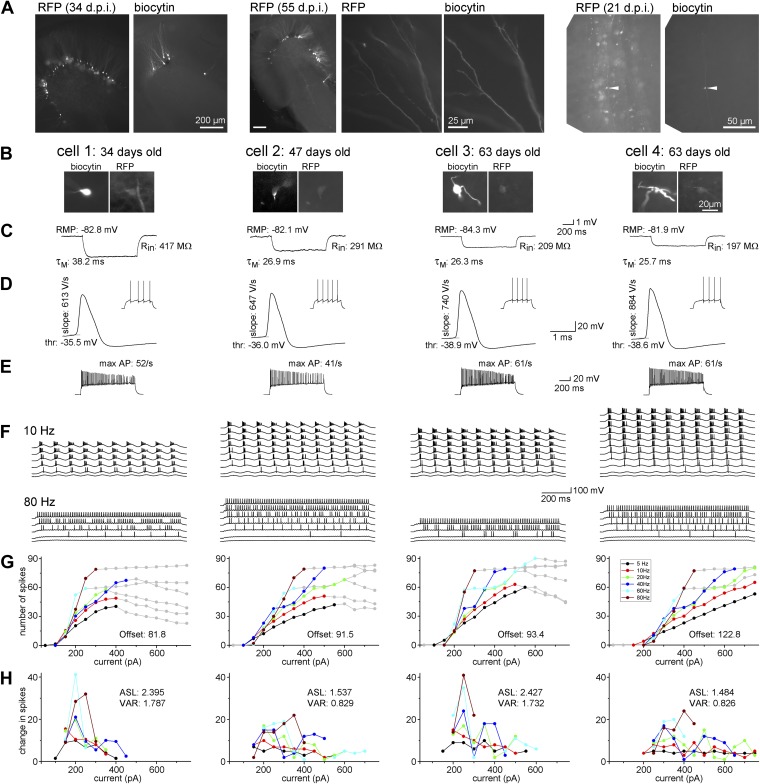
Figure 2. Maturation of the biophysical and integrative properties of ABGCs.
(A) The RFP and biocytin-labeled cells in the dentate gyrus (left panels, d.p.i.: day after virus injection), spiny dendrites (middle panels), and typical mossy fiber terminals in the stratum lucidum of the CA3 region (right) confirm granule cell identity. (B) Four representative RFP-expressing granule cells 34, 47, and 63 days after CAG-RFP virus labeling. The 63-day-old AGBCs were recorded from the same slice. (C) Average subthreshold voltage responses of the example cells to small (−10 pA) current steps. Input resistance (Rin), membrane time constant (τM), and resting membrane potential (RMP) of the cells are indicated. (D) Spike parameters of the example cells at lower current intensities (dV/dt: maximal rate of rise, thr: action potential threshold). (E) Maximal firing rate of the four cells in response to square pulse current injection. (F) Responses of the cells to sinusoidal current injections with increasing amplitude (Δ50 pA) at 10 and 80 Hz. The traces are shown until the firing reached saturation. (G) Number of spikes generated in the example cells as a function of the peak amplitude of the injected sinusoid currents at the all tested frequencies. Gray symbols indicate values that were omitted from the analysis due to lack or saturation of spiking. Offset values describe the minimum input intensities to reach 50% spiking output. (H) Increments of the firing (i.e., the first derivative of the curves in panel F) of the cells. These values were used for the calculation of the average slope (as mean, ASL) and the variance of firing (as variance, VAR). Note that cells 1 and 3 have exceptionally large values at certain input intensity ranges indicating that these cells were more sensitive to certain input intensities. This characteristic is quantified by the large VAR value.

