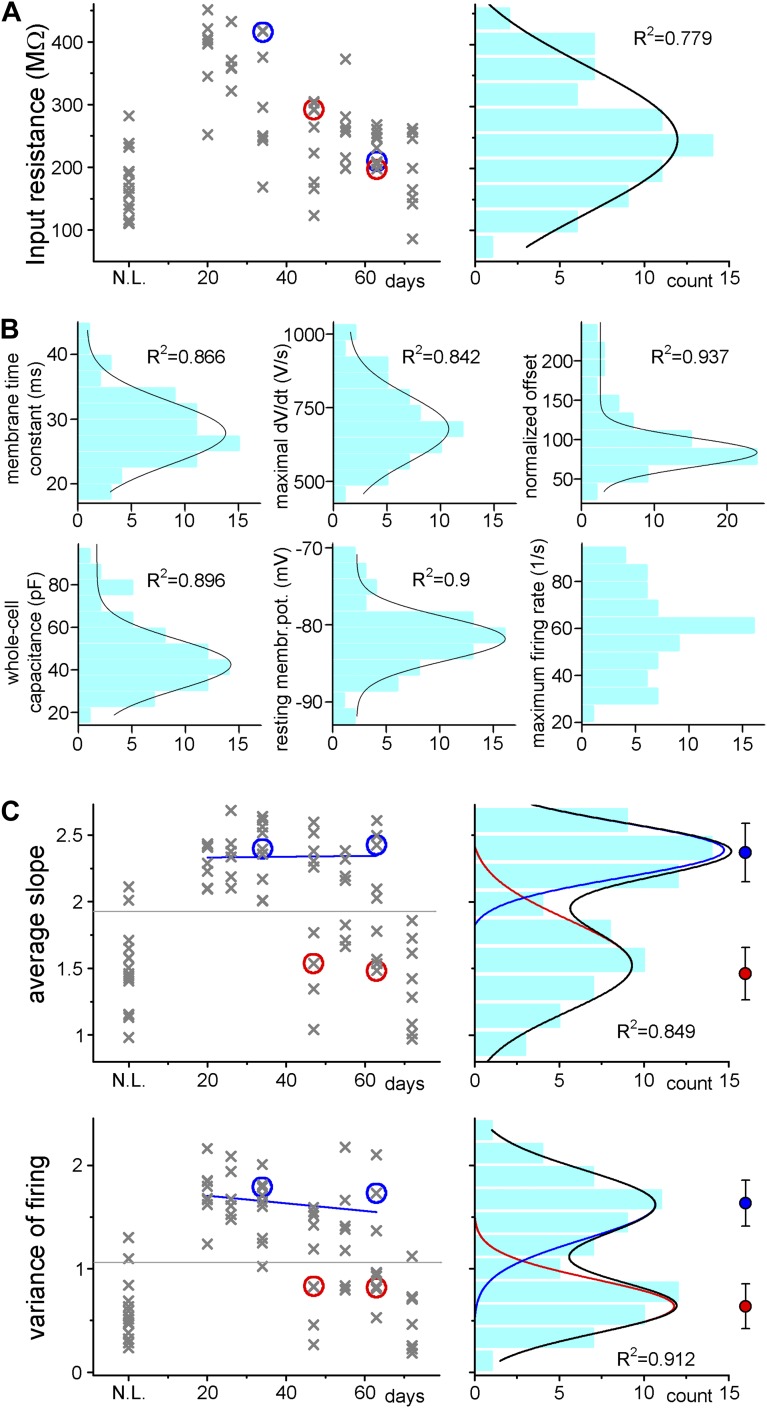
Figure 3. Adult born granule cells (3–10 week old) can be divided into two distinct populations based on cell-to-cell differences in input–output transformation.
(A) Left, input resistance of individual ABGCs with various ages (gray crosses). Red and blue circles (S- and L-group members, respectively) highlight the values for the example cells shown in Figure 1. N.L.: not labeled control cells. Right, probability distribution of the data set shows single peak (single Gaussian fit: F = 0.0001). (B) Monotonous probability distribution of membrane time constant, whole cell capacitance, resting membrane potential, maximal rate of rise of spikes, relative offset of the input–output curves, and action potential threshold data from the same set of cells as above. (C) Left, average slope (top) and variance of the slope (bottom) of the same individual ABGCs as above with various ages (gray crosses). Blue lines indicate the lack of correlation between the gain of the input–output functions and the age of individual cells within the S-group (linear fit, ASL: R2 = −0.029, p = 0.89, VAR: R2 = 0.01, p = 0.257). Right, two population emerges from the distribution of the average slope values of individual cells (two peaks Gaussian, ASL: F = 0.0014, VAR: F = 0.0001). The centers of the two clusters and average distance values from the centers (error bars) are shown on the right (K-means analysis, F < 10−9, horizontal gray lines on the left panels indicate the separation by the K-means analysis).

