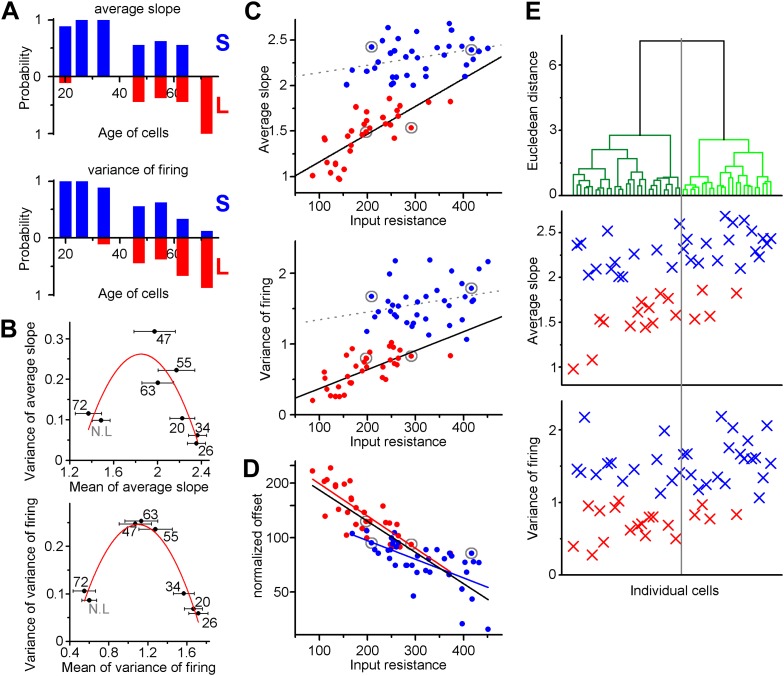
Figure 4. Independence of the output properties of individual ABGCs from age and input resistance.
(A) Probability of the members of the clusters defined by the K-means analysis continuously shifts from S-group (blue) toward L-group (red) during maturation indicating the higher prevalence of ABGCs with shallow and invariable input–output function. (B) The population level functional switch is also suggested by the higher variance of the input–output parameters during the transition age period and low variance in the youngest and most matured populations (parabolic fit, ASL: R2 = 0.611, F(ANOVA) = 0.0035; VAR: R2 = 0.853, F = 0.00017). Numbers indicate the age of the data sets. (C) Correlation of the integrative parameters to the input resistance within the two functionally different groups (red and blue symbols) defined by K-means cluster analysis (see Figure 3). Gray circles indicate the four example cells from Figure 2 (linear fits, ASL: R2 = 0.087, p = 0.045 for S-group, R2 = 0.576, p = 2.9 × 10⁻⁷ for L-group; VAR: R2 = 0.02, p = 0.19 for S-group R2 = 0.467, p = 2.6 × 10⁻⁶ for L-group). (D) Correlation between the normalized current needed to reach output that is half of the input frequency and input resistance of individual ABGCs belonging to the two functionally different groups (R2 = 0.39, p = 0.0001 for S-group; R2 = 0.607, p = 2 × 10⁻⁸ for L-group; R2 = 0.682, p < 10−8 for both groups). (E) Considering multiple membrane parameters of the individual cells (resting membrane potential, membrane time constant, whole cell capacitance, input resistance, threshold, peak dV/dt, maximal firing rate) for hierarchical cluster analysis (Ward method with normalized values) were not sufficient to predict the functional identity of the cells. Data from individual cells are aligned vertically (lines in the upper panel and symbols in the middle and bottom panels). Thus, the order of the points along the X-axes is determined by the results of the cluster analysis.
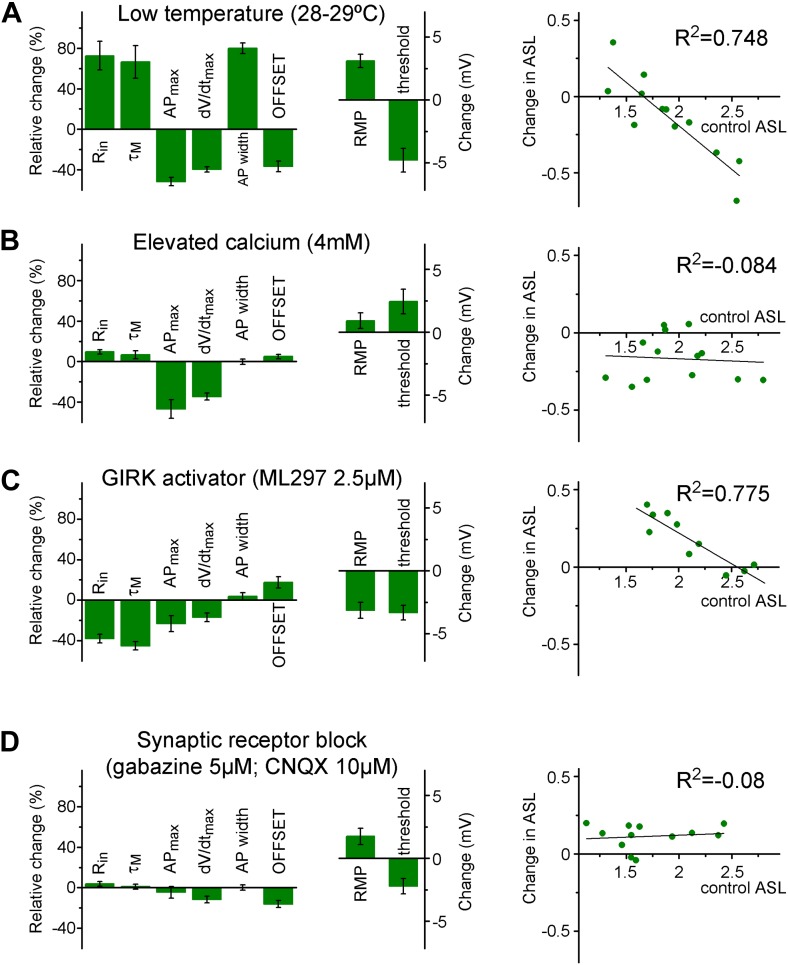
Figure 4—figure supplement 1. Coexistence of S- and L-functionalities among granule cells from non-labeled animals.


