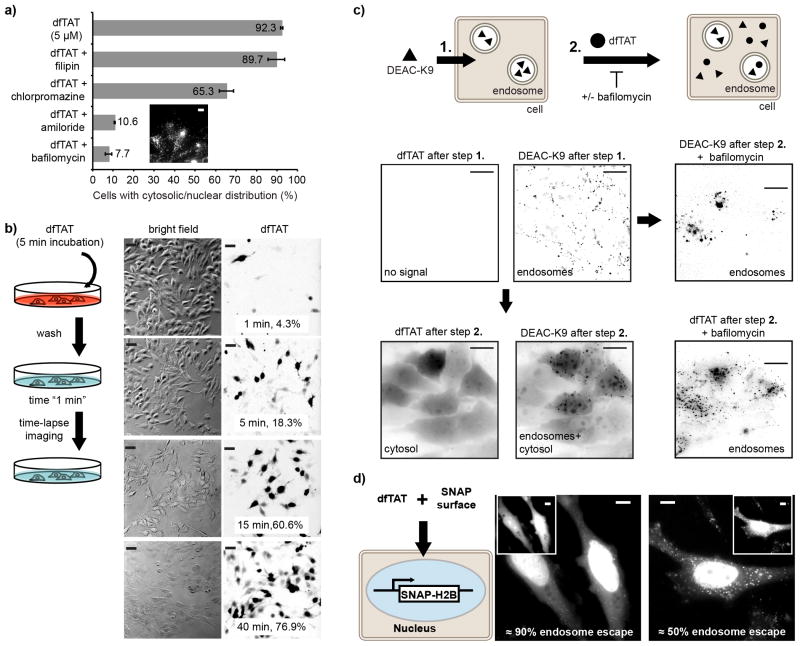
Figure 2.
dfTAT penetrates the cytosol by escaping from the endocytic pathway. (a) Assay showing the effect of endocytosis inhibitors on the cellular distribution of dfTAT. HeLa cells were pre-treated with each inhibitor for 20 min, washed, and incubated with 5 μM dfTAT and inhibitor for 1h. The percentage of cells displaying a cytosolic fluorescence distribution was quantified as in Fig. 1. Insert: image showing a punctate distribution of dfTAT in the presence of bafilomycin (1,000 cells/experiment, experiments were performed in triplicates, mean and corresponding standard deviations represented). Scale bar, 10 μm. (b) Pulse-chase experiment showing the progressive cytosolic penetration of dfTAT. HeLa cells were incubated with dfTAT (5μM) for 5 min, washed and imaged with a 20X objective (TMR fluorescence images are represented as inverted monochrome). The imaging intervals and corresponding percentages of cells with a cytosolic signal are represented. (c) Microscopy images showing that dfTAT causes the cytosolic release of molecules trapped inside endosomes. Hela cells were incubated with 5 μM DEAC-K9 for 1 h and washed. Cells were subsequently incubated with 5 μM dfTAT for 1 h. Images are represented as inverted monochromes. Scale bars, 10 μm. (d) Assay establishing the endosomolytic efficiency of dfTAT. HeLa cells expressing SNAP-H2B were incubated with 5 μM dfTAT and 5 μM SNAP-Surface 488. Representative fluorescence images of SNAP-Surface are shown (dfTAT is in insert). The SNAP-Surface 488 signal present in the nucleus is indicated as a % of the total signal. Scale bars, 10 μm.

