Figure 4.
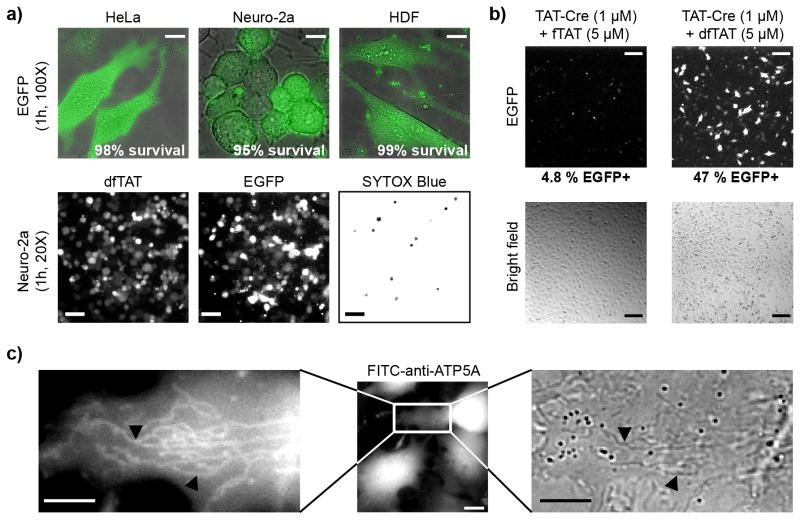
Delivery of intact and functional proteins using co-incubation with dfTAT. (a) Microscopy imaging showing that dfTAT delivers EGFP into the cytosol of live cells. HeLa, Neuro-2a and HDF cells were co-incubated with EGFP (10 μM) and dfTAT (5 μM) for 1 h. Scale bars, 100X objective: 10 μm, 20X objective: 100 μm. (b) Assay showing that dfTAT improves the delivery of TAT-Cre. HeLa cells transfected with a plasmid containing egfp upstream of a loxP-STOP-loxP sequence were incubated for 1 h with either fTAT (5 μM) or dfTAT (5 μM) in the presence of TAT-Cre (1 μM). EGFP+ cells that result from successful TAT-Cre delivery were visualized and counted by microscopy (confirmed by flow cytometry). Scale bars, 100 μM. (c) Microscopy imaging showing that dfTAT mediates the delivery of an antibody. HeLa cells were co-incubated with FITC-anti-ATP5A (20 μg/mL) and dfTAT (5 μM) for 1 h. FITC-anti-ATP5A (green) is delivered in the cytosol of cells and stains tubular mitochondria (more clearly visible in zoomed-in image). Absence of SYTOX Blue staining indicates that the cells imaged do not have a compromised plasma membrane. Black arrows point to tubular mitochondria. Scale bars, 100X objective: 10 μm, zoomed-in image: 2 μm.

