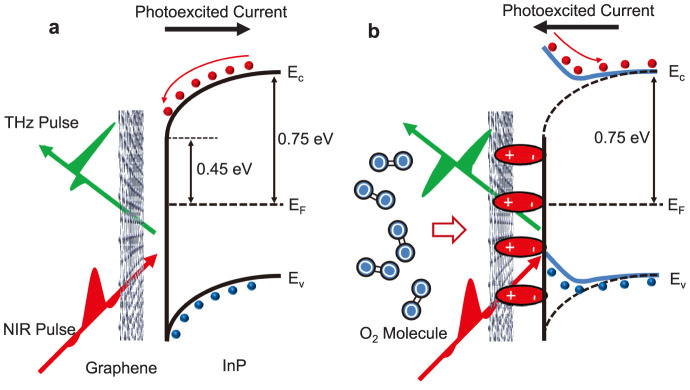
Figure 3. Band diagrams explaining the sign change of THz amplitude due to adsorbed oxygen molecules.

(a), Band diagram for pristine graphene on InP. The photo excited current flows towards the substrate. (b), Band diagram for graphene on InP with adsorbed oxygen molecules between them. The charge transfer between graphene and oxygen creates dipoles, which modify the band bending. The photoexicted current now flows towards the surface.
