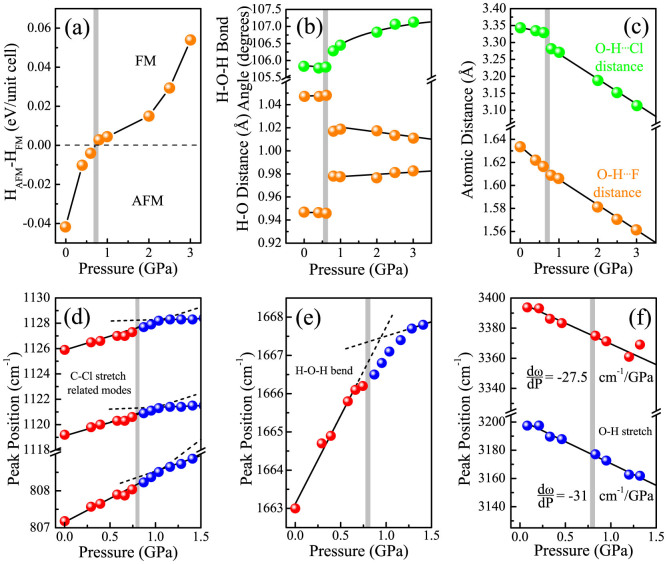
Figure 3.
(a) Relative enthalpy of the CuF2(H2O)2(3-chloropyridine) unit cell, predicting that the ferromagnetic state becomes energetically favored. (b) Calculated H-O bond distances and H-O-H bond angle and (c)  and
and  distances all indicate sharp changes at the critical pressure. The grey lines indicate the transition pressure which is in excellent agreement with the experimental pressure (0.75 vs. 0.8 GPa). (d) Experimental frequency versus pressure at 300 K for three modes involving the C-Cl bond, (e) H-O-H bend, and (f) O-H stretches. All modes involving the C-Cl bond show slight increases in dω/dP around the transition. The H-O-H bend hardens significantly with pressure. The difference in dω/dP (−27.5 ± 2 vs. −31 ± 1 cm−1/GPa) for the two O-H stretches results in increased splitting between the features. Lines are drawn to guide the eye and help visualize different mode behaviors through the transition.

