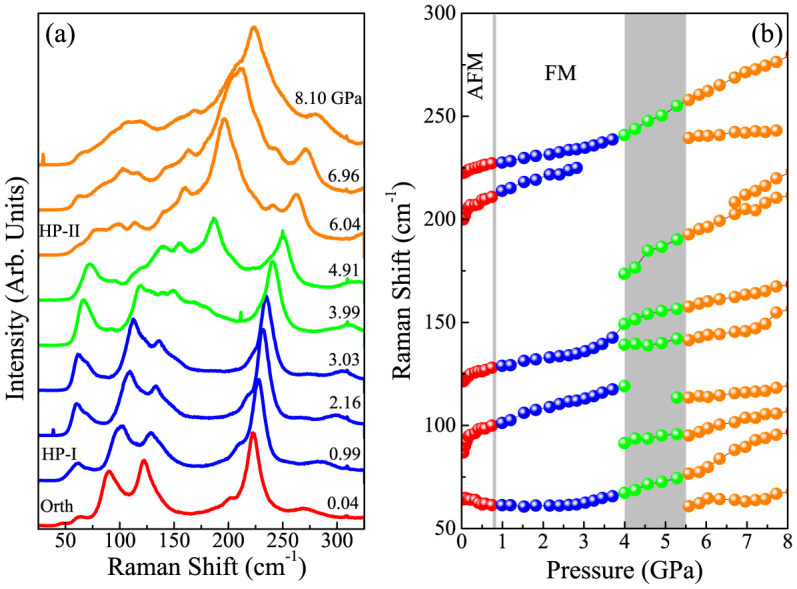
Figure 4.

(a) Raman spectra as a function of pressure. The change in line color denotes a new phase (or coexistence of phases). (b) Raman shift versus pressure over the full pressure range investigated. The critical pressures are marked with grey vertical bands. The orthorhombic to high pressure phase I transition is at 0.8 GPa, and the broad transition with the coexistence of high pressure phases I and II is between 4 and 5.5 GPa. Here, Orth is Pmna orthorhombic (although at low temperature, the material is P21/c monoclinic in this regime)31, HP-I is the first high pressure phase, HP-II is the second high pressure phase, AFM is antiferromagnetic, and FM is ferromagnetic. The magnetic phases are present at low temperature.
