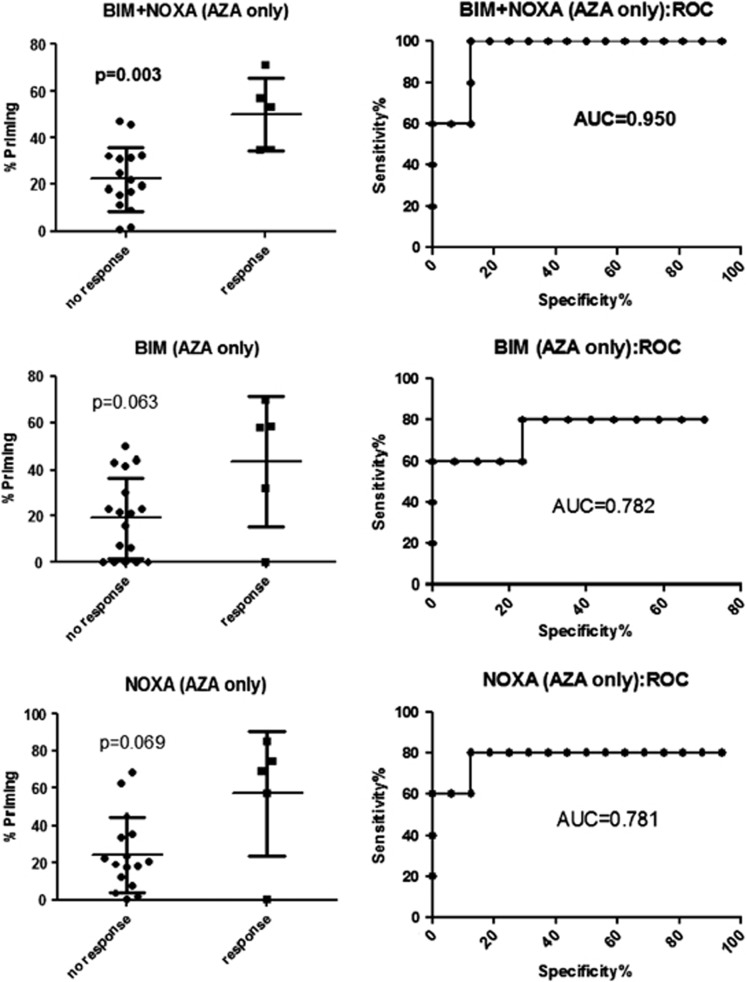
Figure 5.
BH3-profiling metrics correlate with clinical 5-Azacytidine-based response. Clinical response to 5-Aza-based therapy (N=22) is plotted against % priming by BH3 profiling for the indicated BH3 peptide(s). Clinicopathologic variables are shown in Supplementary Table 1.

