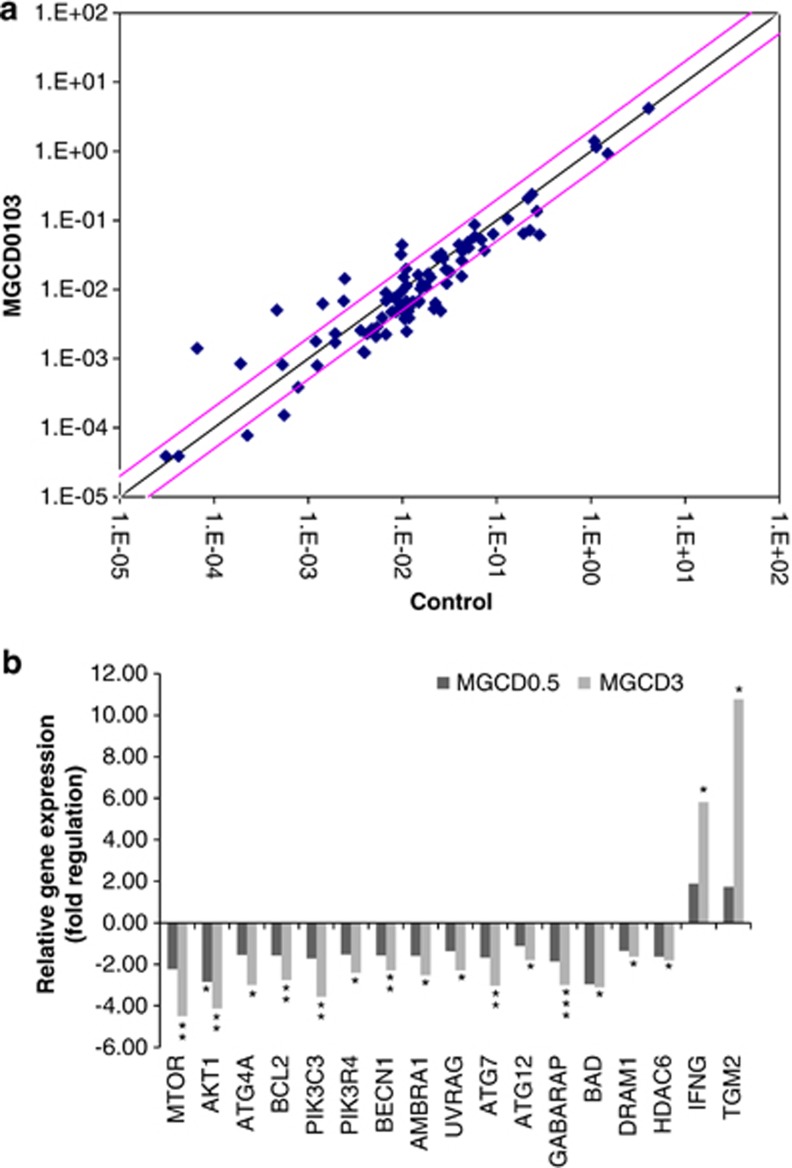
Figure 4.
MGCD0103 modulates autophagy gene expression at the transcriptional level in primary CLL cells. Screening for autophagy gene expression in PBMCs incubated with or without MGCD0103 for 24 h was performed using an autophagy PCR array. Results represent the mean values of four independent experiments. (a) The scatter plot graphs the expression level (2-ΔCt) of each gene in the control sample versus the MGCD0103 (3 μmol/l) sample. The black line indicates fold changes (2-ΔΔCt) of 1. The pink lines indicate a fold change of 2 in gene expression. (b) Histograms represent the fold up- or downregulation of relative gene expression in primary CLL cells incubated with MGCD0103 (0.5 and 3 μmol/l) for 24 h. When fold change values are >1, the fold regulation is equal to the fold change. When fold change values are <1, the fold regulation is the negative inverse of the fold change. *P<0.05, **P<0.01 and ***P<0.001.

