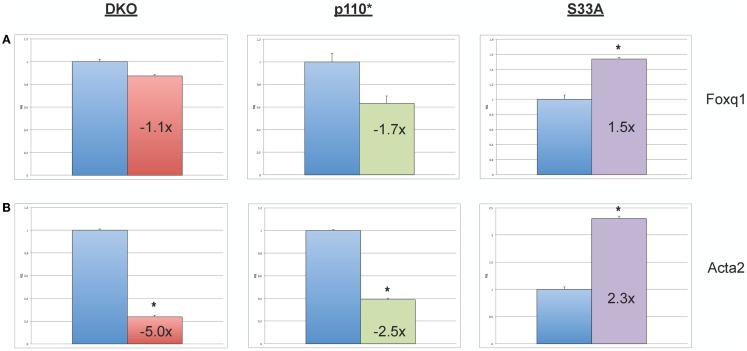
Figure 5.
Validation of genes whose expression is decreased in p110* ESCs, but not S33A ESCs. (A) qPCR of Foxq1. (B) qPCR of Acta2. For both results: RQ = relative quantification (all values were normalized to a Gapdh endogenous control); error bars represent standard error of the mean (SEM) between biological replicates (n = 3) and technical replicates (n = 3; n = 9 total for each gene in each cell line) (*p < 0.001, two-tailed t test); and fold changes compared to WT are shown.

