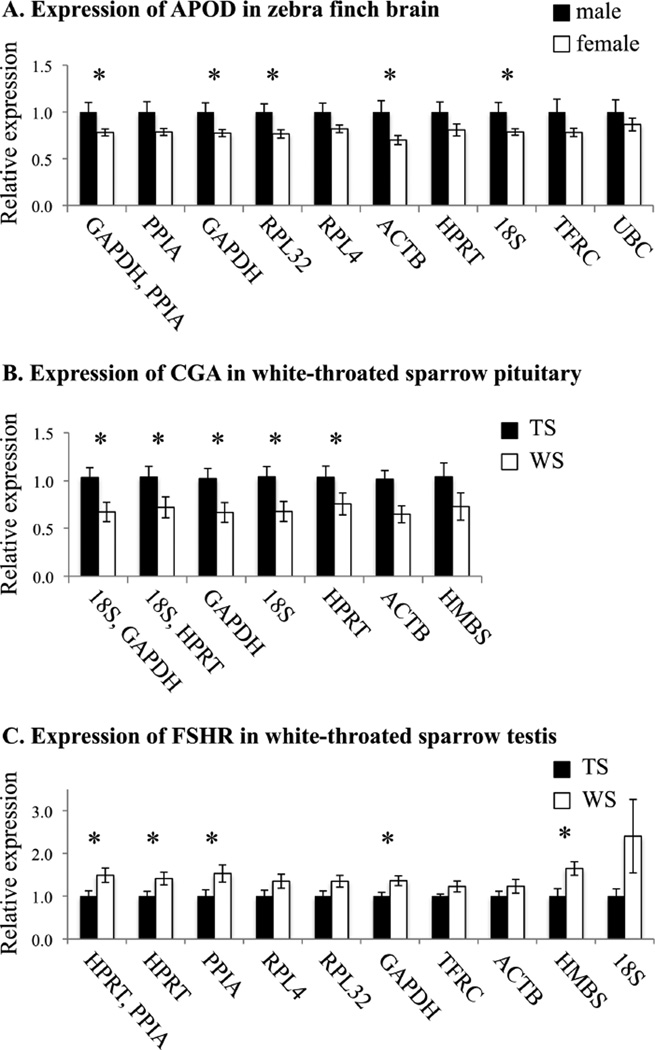
Figure 1.
Target gene expression when normalized to the reference genes evaluated in this study. A) Expression of APOD in zebra finch brain. B) Expression of CGA in female white-throated sparrow pituitary. C) Expression of FSHR in white-throated sparrow testis. Reference genes used for normalization are indicated on the x-axis, in the order recommended by the software program NormFinder (see text). In order to plot all of the ratios on the same graph, all APOD ratios were normalized to the average male value and all CGA and FSHR ratios were normalized to the average tanstriped value. Values for CGA are represented as estimated marginal means. Error bars represent standard error of the mean (A,C) or standard error of the estimated marginal mean (B). APOD: Apolipoprotein D; CGA: chorionic gonadotropin alpha polypeptide; FSHR: follicle stimulating hormone receptor; TS: tanstriped; WS: white-striped. *p value < 0.05; see Table 6 for statistics.

