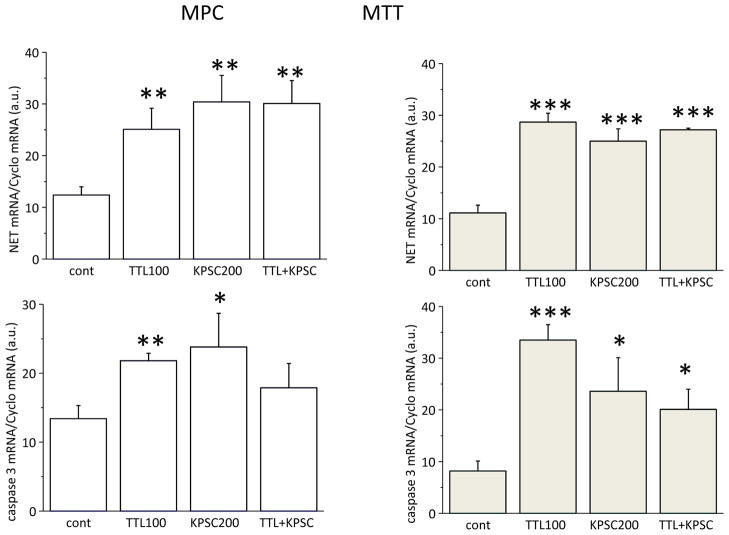
Figure 4.
Comparison of the effect of 100 nM TTL and 200 μM KPSC in MPC (left) and MTT (right) cells on NET mRNA (upper part) and caspase 3 mRNA (bottom part). In accordance with the TTL effect, KPSC also significantly increased both NET and caspase 3 mRNA. Results are displayed as mean ± S.E.M. and represent an average of at least five parallels from two independent cultivations. Statistical significance compared to control represents * - p>0.05, ** - p>0.01 and *** - p>0.001.

