Figure 4.
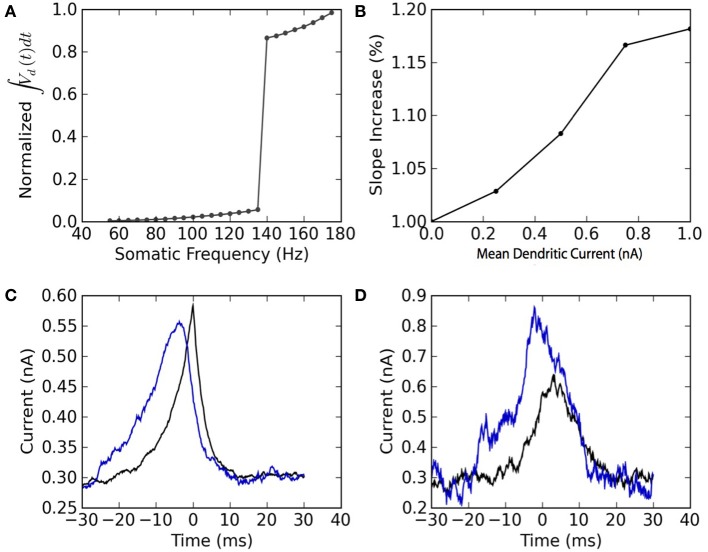
The model reproduces the qualitative features of active dendrites reported in Larkum et al. (1999) and Larkum et al. (2004). (A) Dendritic non-linearity is triggered by somatic spiking above a critical frequency. Somatic spike-trains of 5 spikes are forced in the soma of the mathematical model at different firing frequencies. The normalized integral of the dendritic voltage is shown as a function of the somatic spiking frequency. (B) Dendritic injection modulates the slope of the somatic spiking-frequency vs. current curve. The slope of the frequency vs mean somatic current as measured between 5 and 50 Hz is plotted as a function of the mean dendritic current. Both somatic and dendritic currents injected are Ornstein-Uhlenbeck processes with a correlation time of 3 ms and a standard deviation of 300 pA. (C) Spike-triggered average of the current injected in the soma (black) and in the dendrites (blue). (D) Burst-triggered average of the current injected in the soma (black) and in the dendrites (blue). The fact that the blue curve is higher than the black curve, and that this relation is inverted in (C), may be interpreted as a top-down coincidence detection by bursts.

