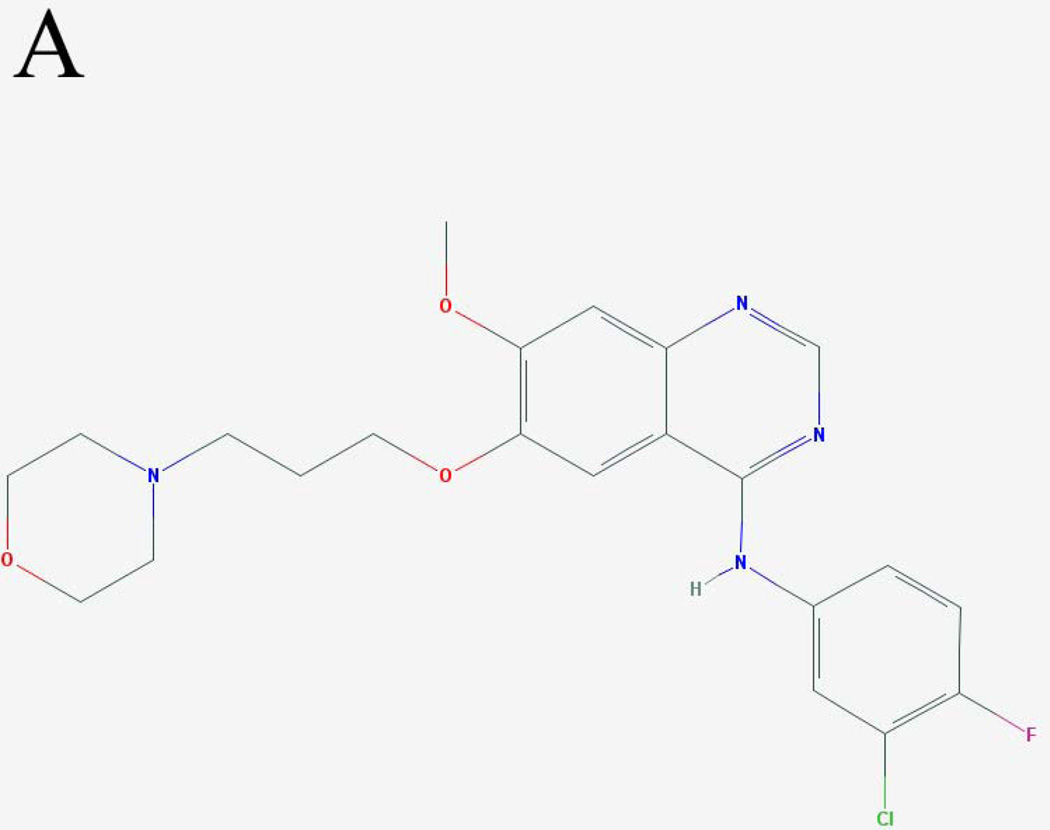
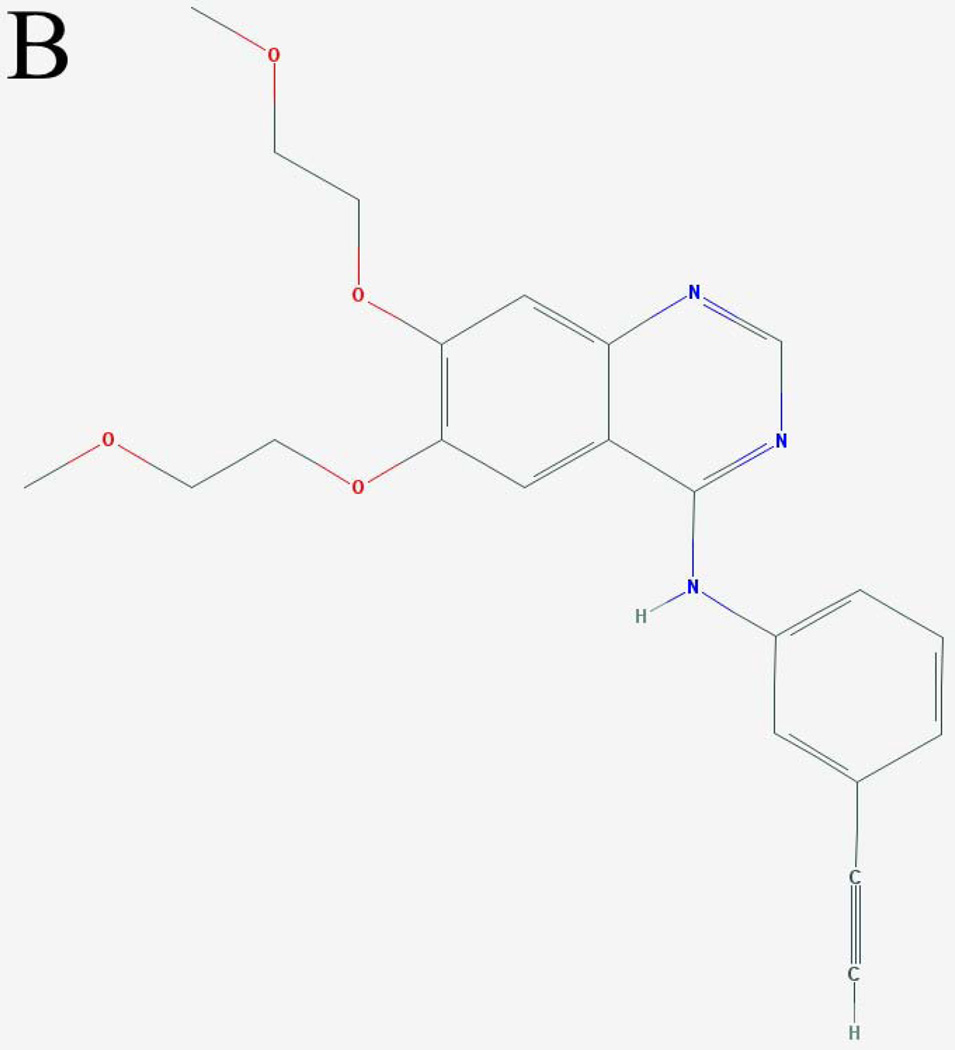
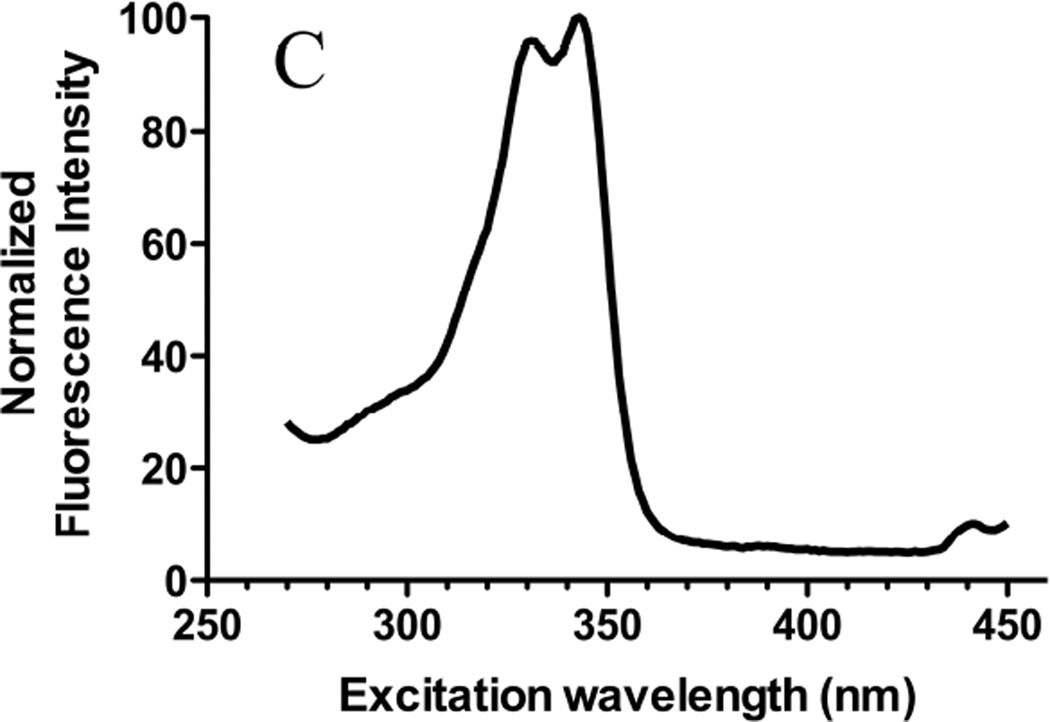
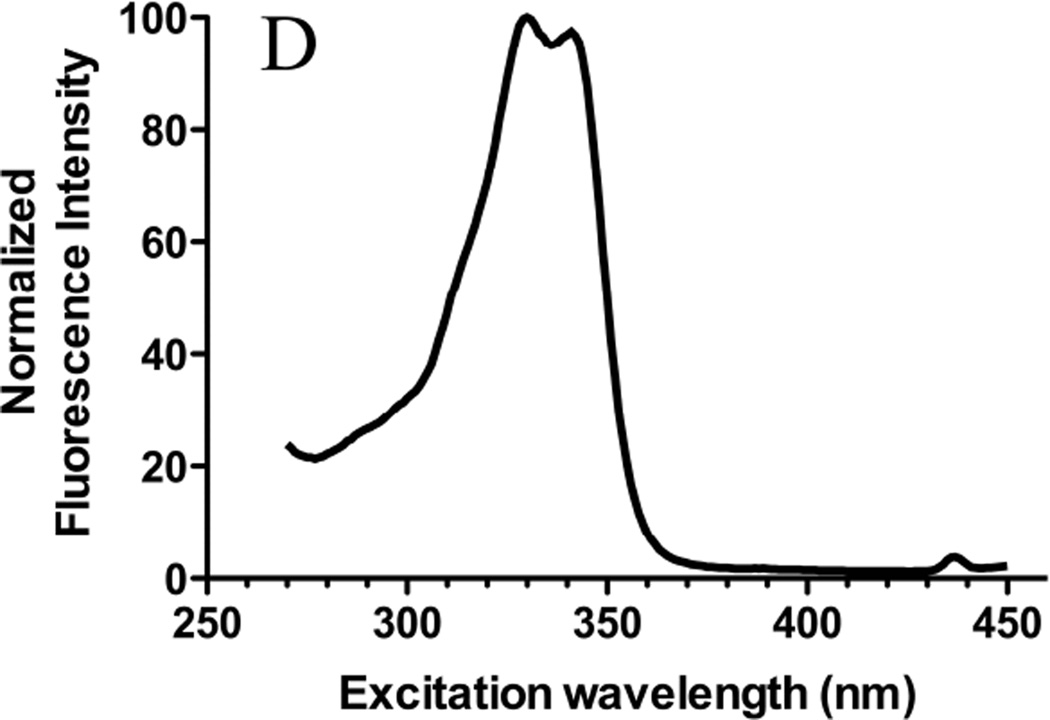
Figure 1. Molecular structures and excitation spectra of gefitinib and erlotinib.
The molecular structures of (A) gefitinib (entry CID 123631) and (B) erlotinib (entry CID 176870) obtained from the PubChem compound database (http://www.ncbi.nlm.nih.gov/pccompound/). Normalized excitation spectra in n-hexanes of 15 µM (C) gefitinib and (D) erlotinib. Emission wavelength was 500 nm.


