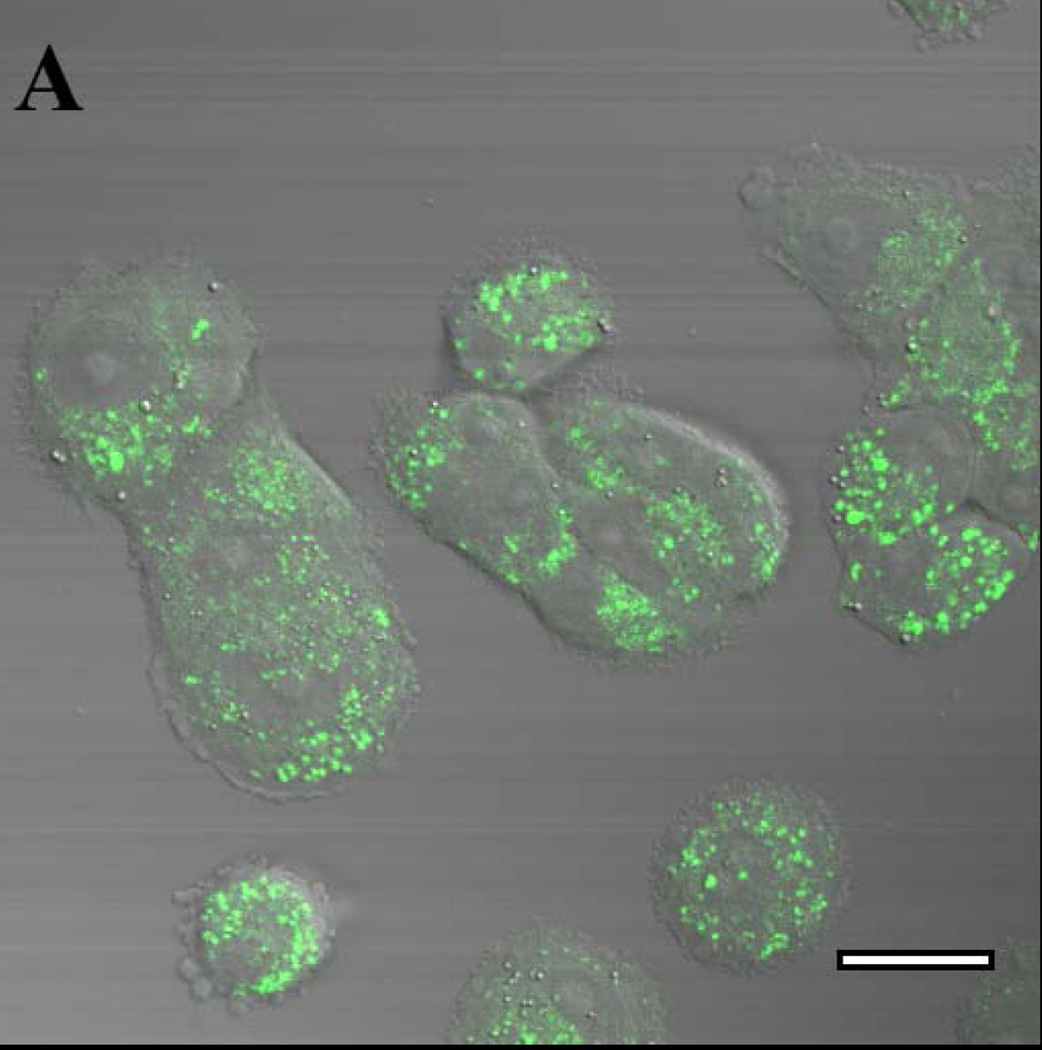
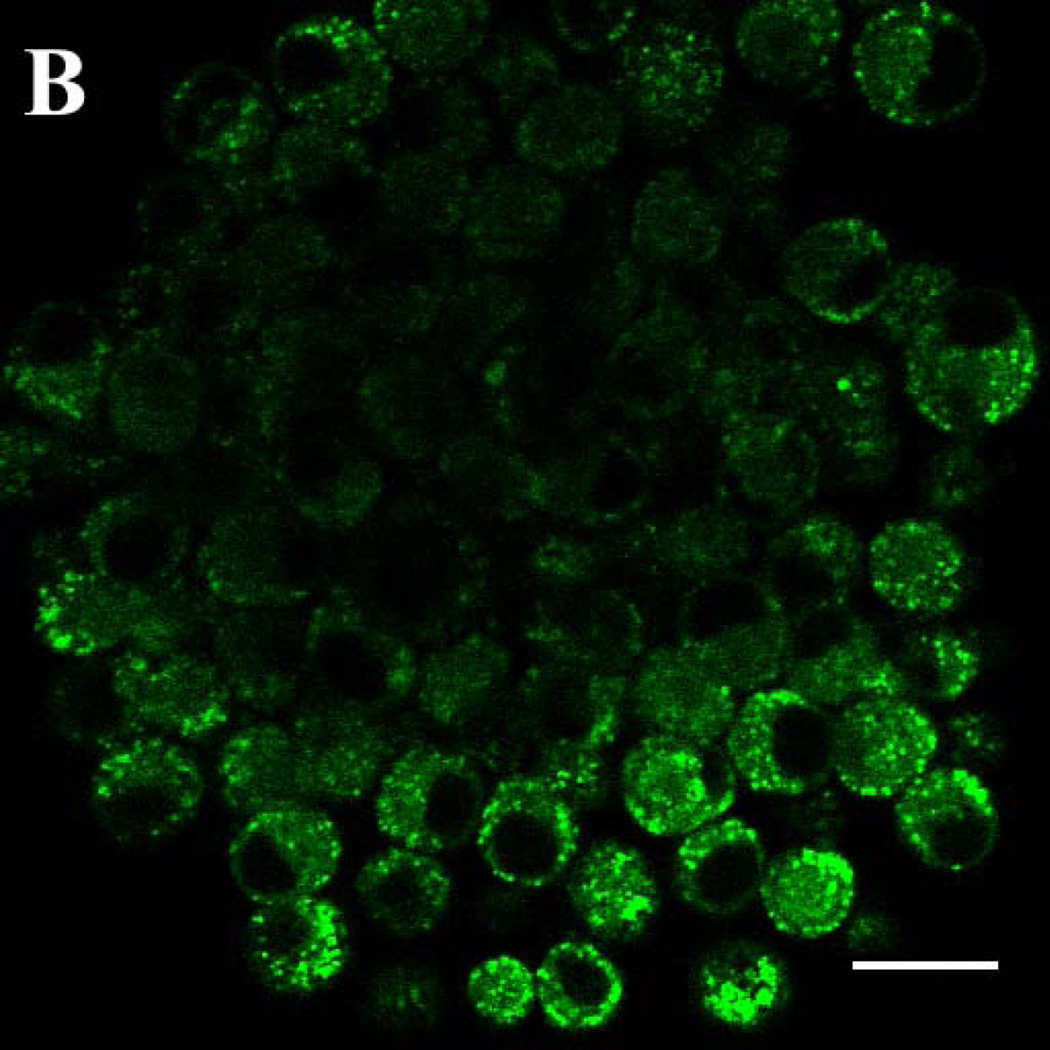
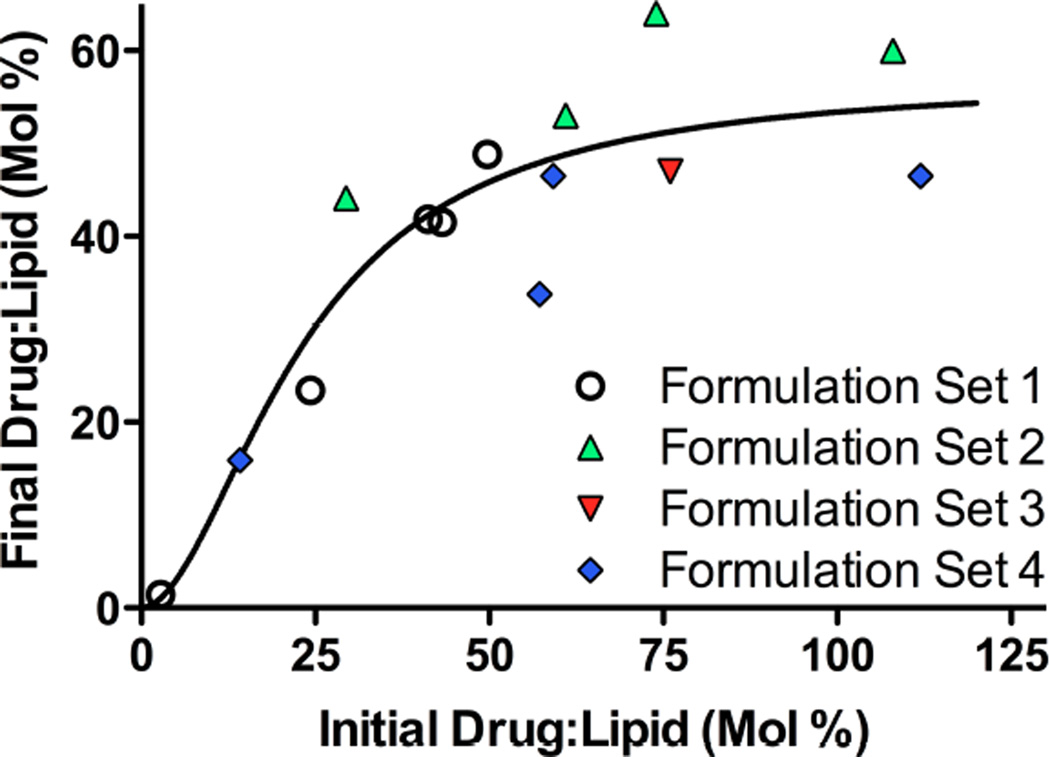
Figure 2. Solvent-dependent fluorescence emission spectra of gefitinib and erlotinib.
Gefitinib or erlotinib were suspended at 15 µM in a variety of solvents, and fluorescence emission spectra were acquired. Excitation was at 340 nm. Spectra are uncorrected for the concentration of drug in solution. (A) Spectra of gefitinib in chloroform (triangles) or acetonitrile (filled squares); left ordinate indicates intensity scale. Scale on right ordinate for gefitinib in ethanol (filled circles) or n-hexanes (inverted triangles) is expanded to demonstrate red- and blue shifts. No detectable emission peak was observed for gefitinib in Tris-buffered saline (not shown). (B) Emission spectra of erlotinib in various solvents; symbols, axis scales are the same as in (A). No detectable emission peak was observed for erlotinib in Tris-buffered saline. (C) Normalized emission spectra of gefitinib. Filled squares: 20 µM drug in Tris-buffered saline with 10% newborn calf serum; the peak was 390 nm. Filled triangles: spectrum of 15 µM gefitinib incorporated in bilayer of liposomes composed of DSPC:PEG-DSPE (9:1 mol:mol); peak was 380 nm. No emission was observed for blank liposomes (not shown). Filled circles: fluorescence of 15 µM gefitinib encapsulated in the liposome core by remote loading in DSPC:PEG-DSPE:Chol (9:1:5 mol:mol:mol) liposomes immediately after dilution into TBS or (open circles) 1d after incubation at 37°C in TBS; the emission peak was 460 nm. The day-1 spectrum (open cirles) was normalized to the emission peak. The day-0 spectrum (filled circles) is shown in its original intensity relative to the day-1 spectrum.


