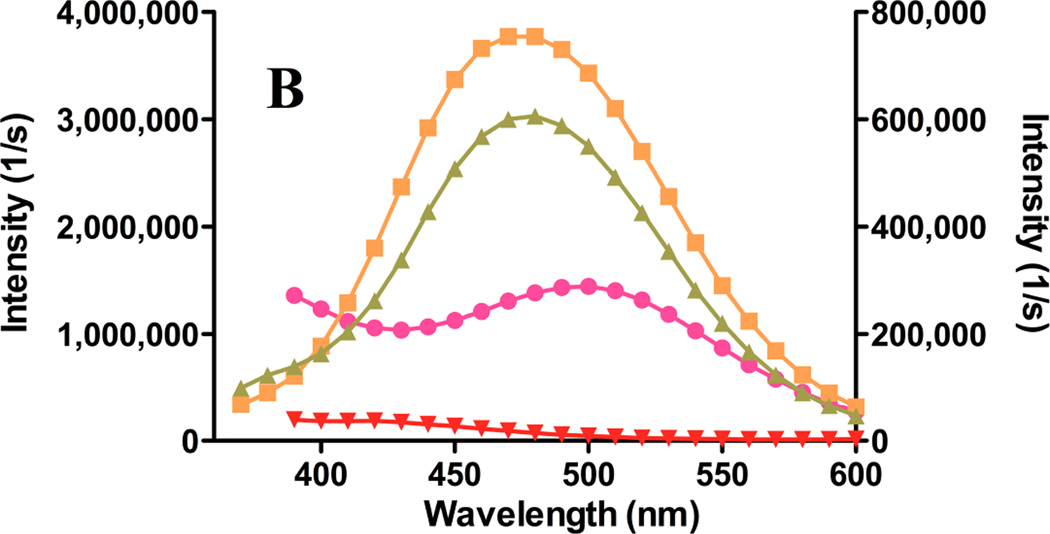
Figure 7. Release of gefitinib from remote-loaded liposomes.
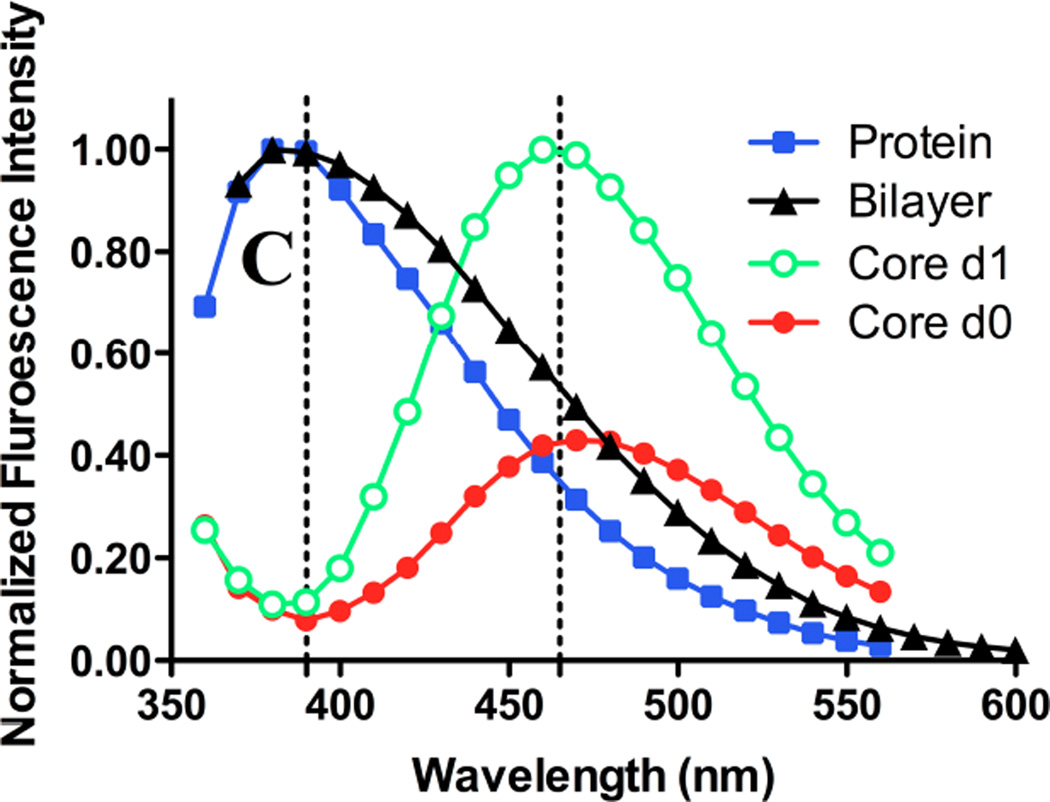
Gefitinib fluorescence from remote-loaded liposomes of DSPC:PEG-DSPE:Chol (9:1:5 mol:mol:mol) during incubation 37°C in the presence or absence of serum was monitored at intervals over several days. The excitation wavelengths were 465 nm (A), a spectral band unique to drug precipitated in the liposome core, and 320 nm (B) the spectral band in which protein-bound drug fluoresces. On day 0, freshly-prepared liposomes were diluted to a final concentration of 20 µM in TBS or in TBS containing 10% newborn calf serum, and incubated at 37°C. An equivalent amount of free crystalline free drug was also incubated under the same conditions in order to estimate effect of drug dissolution rate on the rate of fluorescence signal change if 100% of the drug were present as a precipitate in the liposome formulations. (A) Gefitinib intensity at 465 nm, the peak wavelength characteristic of drug within the aqueous core of remote-loaded liposomes. Squares: crystalline free gefitinib in Tris-buffered saline; triangles: liposomal gefitinib in Tris-buffered saline; diamonds: crystalline gefitinib in serum-containing buffer; circles: liposomal gefitinib in serum-containing buffer; inverted triangles: serum-containing buffer without drug. The progressively increasing intensity from crystalline gefitinib in serum-containing buffer represents a spectral shoulder of the serum-bound drug emission peak at 394 nm, which was intense by day 2–3. (B) Gefitinib intensity at 394 nm, which is the peak wavelength of protein-bound drug. Symbols are the same as in (A). For experiments in which drug fluorescence was measured in serum-containing buffer, a standard curve consisting of known amounts of gefitinib added from a concentrated DMSO stock to the identical buffer was prepared, to ensure that fluorescence varied linearly with the concentration of released (free) gefitinib.


