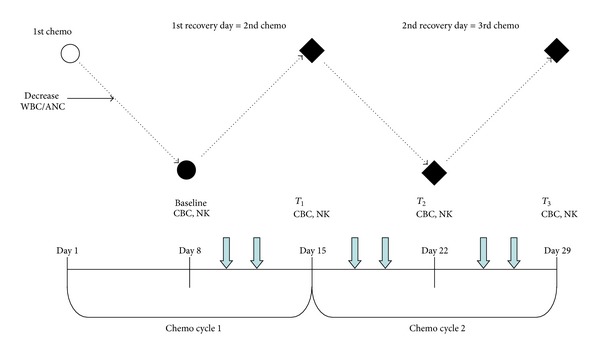
Figure 2.

Study flow chart. Black solid dots: time points of outcome measurements. Open circle: first chemotherapy day. Black diamonds: the primary endpoints of the study. Dashed lines: the expected changes, during chemotherapy, of white blood cells (WBC) and absolute neutrophil counts (ANC). Short, blue down arrows: acupuncture treatments. CBC, complete blood counts; NK, NK cells and subsets.
