Figure 7.

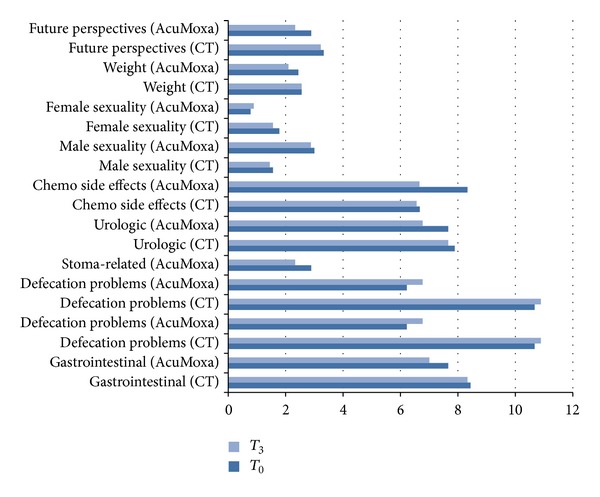
Symptoms related to QOL questionnaires. Differences among groups at the beginning (T 0) and at the end (T 3) of the study. CT, control group; AcuMoxa, experimental group.

Symptoms related to QOL questionnaires. Differences among groups at the beginning (T 0) and at the end (T 3) of the study. CT, control group; AcuMoxa, experimental group.