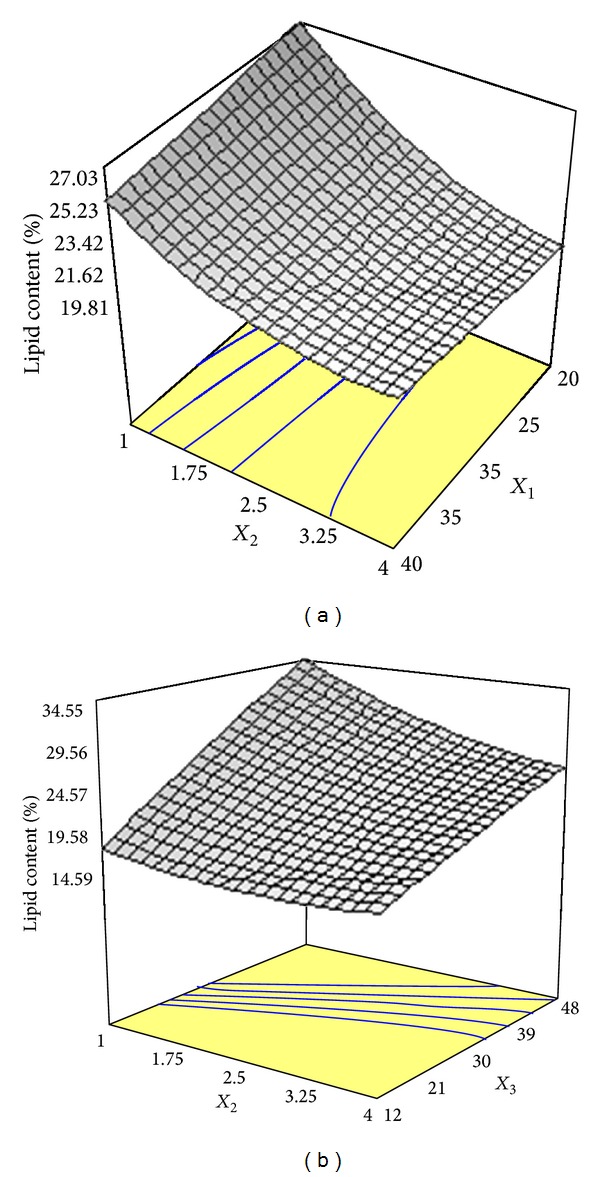
Figure 3.

(a) Response surface plot showing the simultaneous effects of glucose concentration (X 1) and ammonium tartrate concentration (X 2) on lipid content produced by Cunninghamella bainieri 2A1 in repeated batch fermentation at 30°C for 96 h. (b) Response surface plot showing the simultaneous effects of ammonium tartrate concentration (X 2) and harvesting time (X 3) on lipid content produced by Cunninghamella bainieri 2A1 in repeated batch fermentation at 30°C for 96 h.
