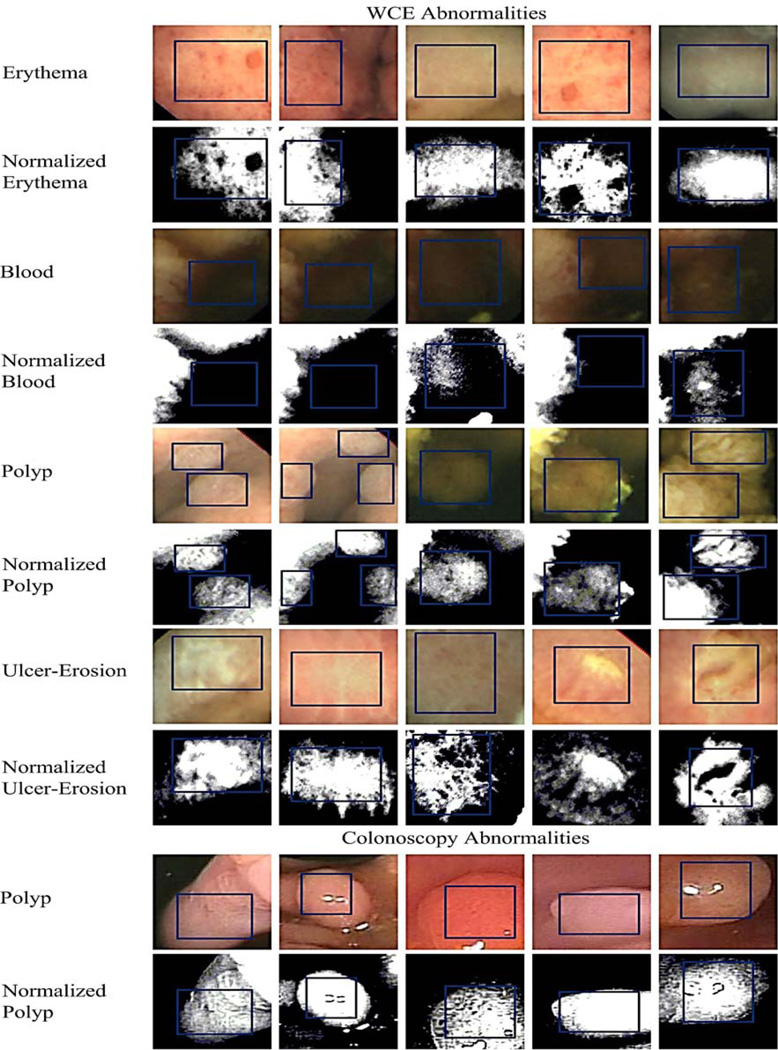
Fig. 3.
Sample abnormal image textures from WCE and colonoscopy. For every abnormal texture, top row shows the original image texture and bottom row shows the normalized image textures. Blue rectangles point to the exact abnormal texture region. For training stage 1 (i.e., texton generation), we extract the regions shown using blue rectangles.

