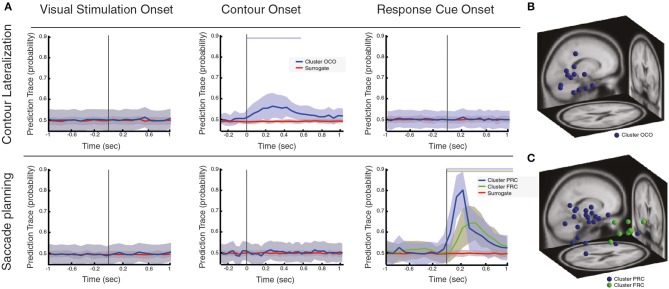
Figure 3.
Local oscillatory activity during contour linking process and saccadic control. (A) Prediction traces at three different behavioral events (i.e., VS, visual stimulation; CO, contour onset; RC, response cue), for two different conditions of interest: contour lateralization and saccade planning. Prediction traces of neural sources across subjects are shown in blue/green (mean ± std), while prediction traces of the surrogate data is shown in red (mean ± std). Significance of prediction traces is shown as a shadow in upper part of the plot, colorcoded for different clusters (p < 0.01, corrected for multiple comparison). (B) Dipole localization of neural sources associated with contour lateralization within CO onset. (C) Dipole localization of neural sources associated with saccade planning within RC onset.

