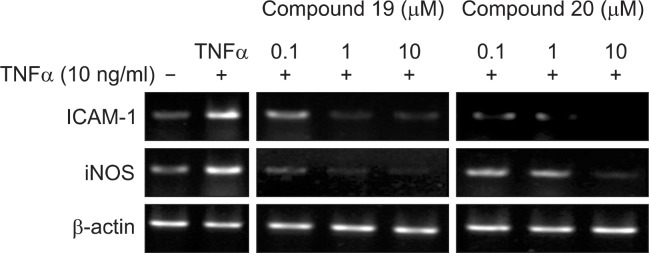
Fig. 3.

Effects of compounds 19 and 20 on iNOS and ICAM-1 mRNA expression in HepG2 cells. –: cells were treated without 10 μg/mL TNFα and compounds; +: cells were treated with 10 μg/mL TNFα only; + 0.1, 1, 10: cells were treated with 10 μg/mL TNFα and compounds.
