
Fig. 4. Reduced lung and liver inflammatory infiltrates in etanercept-treated Sh3bp2KI/KI mice.
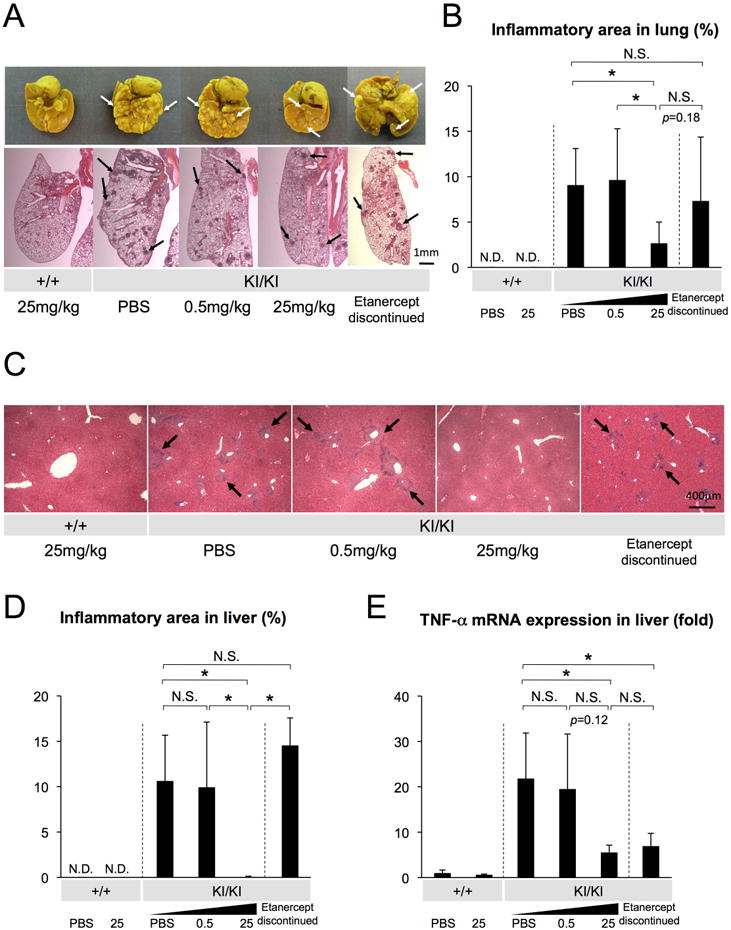
(A) Lung tissues fixed with Bouin's solution (top), and H&E-stained lung tissue sections (bottom). Arrows indicate inflammatory nodules on the lung surface (white) and in sections (black). (B) Quantitative analysis of total inflamed areas in lung. (C) Liver sections from PBS- or etanercept-treated Sh3bp2+/+ and Sh3bp2KI/KI mice (H&E). Arrows indicate inflammatory infiltrates surrounding vessels. (D) Quantitative measurement of total area of the inflammatory infiltrates in liver. (E) Quantitative-PCR analysis of TNF-α mRNA expression in liver. Values are the average of 2-9 independent RNA samples from each group. Average expression level of two Sh3bp2+/+ mice treated with PBS was set as 1. Error bars represent SD. Asterisks represent significant difference (p < 0.05). N.S.: not significant. N.D.: not detected. n=6-7. In Fig. 4E, n=3-9 per group except for n=2 in each Sh3bp2+/+ group.