
Figure 1.
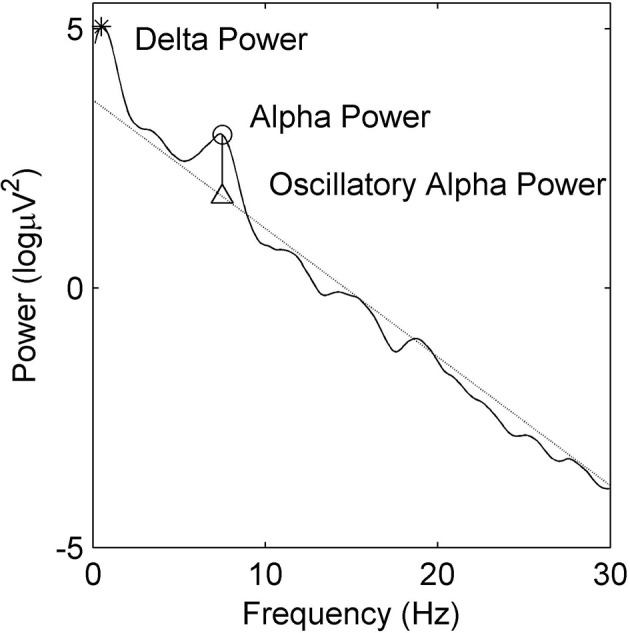
Example power spectral density estimate showing absolute delta (∗) and alpha (◦) power. Oscillatory alpha power is the difference between maximal alpha power (◦) and the alpha power at the linear regression estimate (△).
Official websites use .gov
A
.gov website belongs to an official
government organization in the United States.
Secure .gov websites use HTTPS
A lock (
) or https:// means you've safely
connected to the .gov website. Share sensitive
information only on official, secure websites.
Example power spectral density estimate showing absolute delta (∗) and alpha (◦) power. Oscillatory alpha power is the difference between maximal alpha power (◦) and the alpha power at the linear regression estimate (△).