
Figure 4. A simple circuit model reproduces the neural and behavioral effects of optogenetically suppressing pyramidal neurons (PNs).
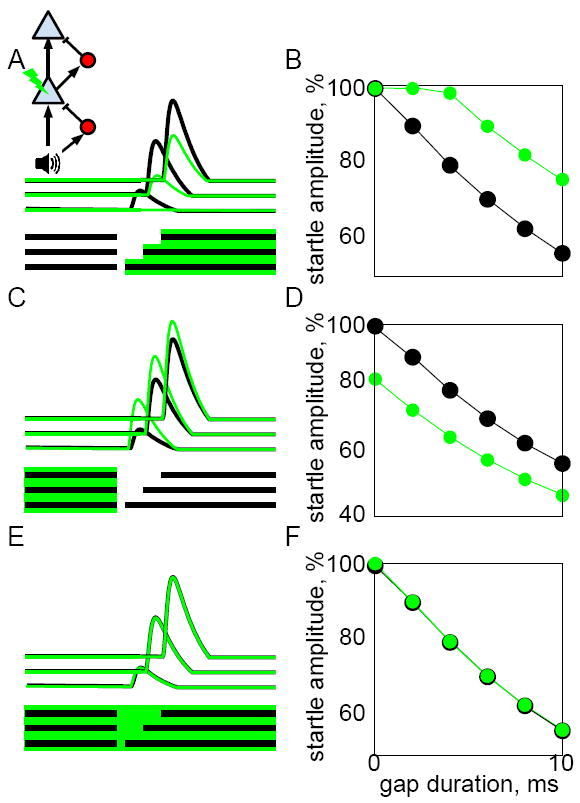
A) Inset: in the circuit model, sound input is passed through two layers, each consisting of a PN (blue triangle) and an IN (interneuron: red circle). The IN computes an exponentially weighted running average of its input, and produces a subtractive output to its target. Optogenetic suppression of the lower PN is indicated by a lightning bolt symbol and was simulated by a subtractive term. Gap stimuli are indicated by horizontal black bars; gaps of 2, 6, and 10ms are shown. Black lines show the responses of the upper PN to each gap stimulus; green lines show the same responses when simulated optogenetic suppression was applied during the time indicated by the green shaded region below. Note that post-gap suppression reduced the PN gap termination response. B) We modeled behavioral gap detection readout (black symbols) by reducing startle amplitude proportional to the amplitude of the PN gap termination response. Green symbols show gap detection during suppression of the post-gap period as indicated in (A). Compare to Figure 3D-E. C-D) Suppression applied during the pre-gap period had the opposite effect of increasing PN gap termination responses (C), and enhancing gap detection (D). E-F) Prolonged suppression applied during the entire pre- and post-gap period had no effect on PN responses (E) or gap detection performance (F).