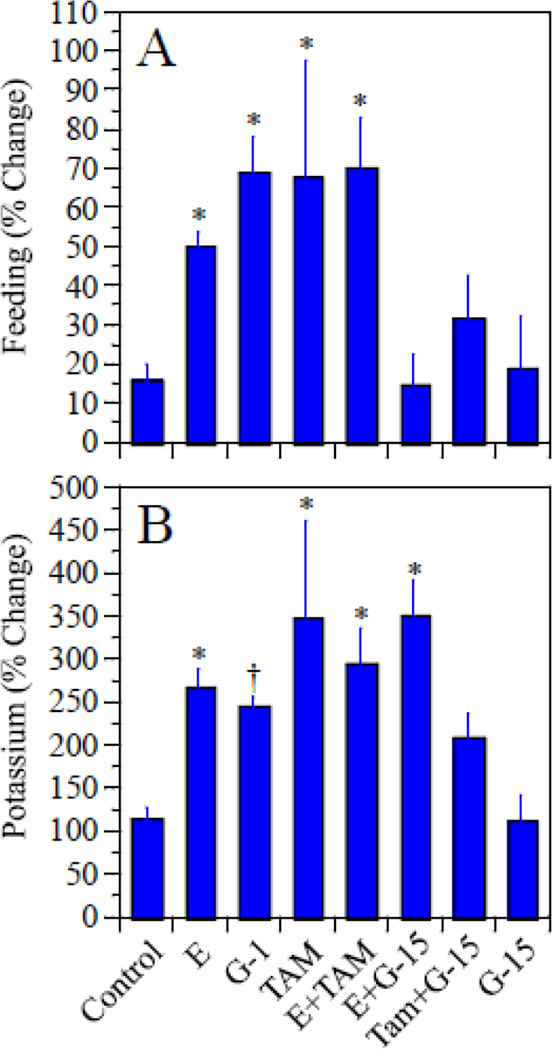
Figure 2.
Percent change in ACh release associated with feeding (A) and with elevated potassium(B). In this case, each rat served as its own control in calculating percent change in release. *p<0.05 relative to controls. †p<0.03 relative to controls only after removing the TAM group from the analysis. See text for discussion.

