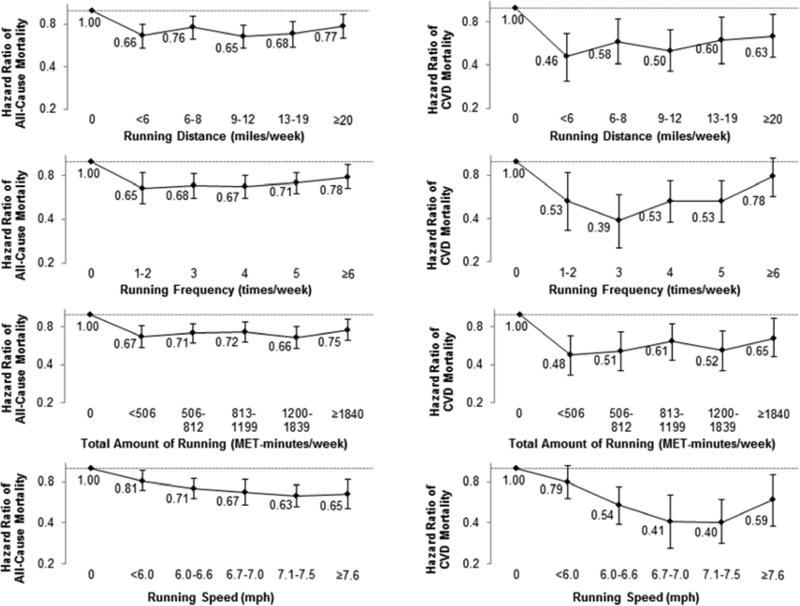
Figure 2. Hazard Ratios of All-Cause and Cardiovascular Mortality by Running Distance, Frequency, Total Amount, and Speed.
Participants were classified into six groups: non-runners and five quintiles of each running distance, frequency, total amount, and speed. All hazard ratios were adjusted for baseline age (years), sex, examination year, smoking status (never, former, or current), alcohol consumption (heavy drinker or not), other physical activities except running (0, 1-499, or ≥500 MET-minutes per week), and parental cardiovascular disease (yes or no). The bars indicate 95% confidence intervals and hazard ratios are shown next to the bars.
CVD=cardiovascular disease, MET=metabolic equivalent.

