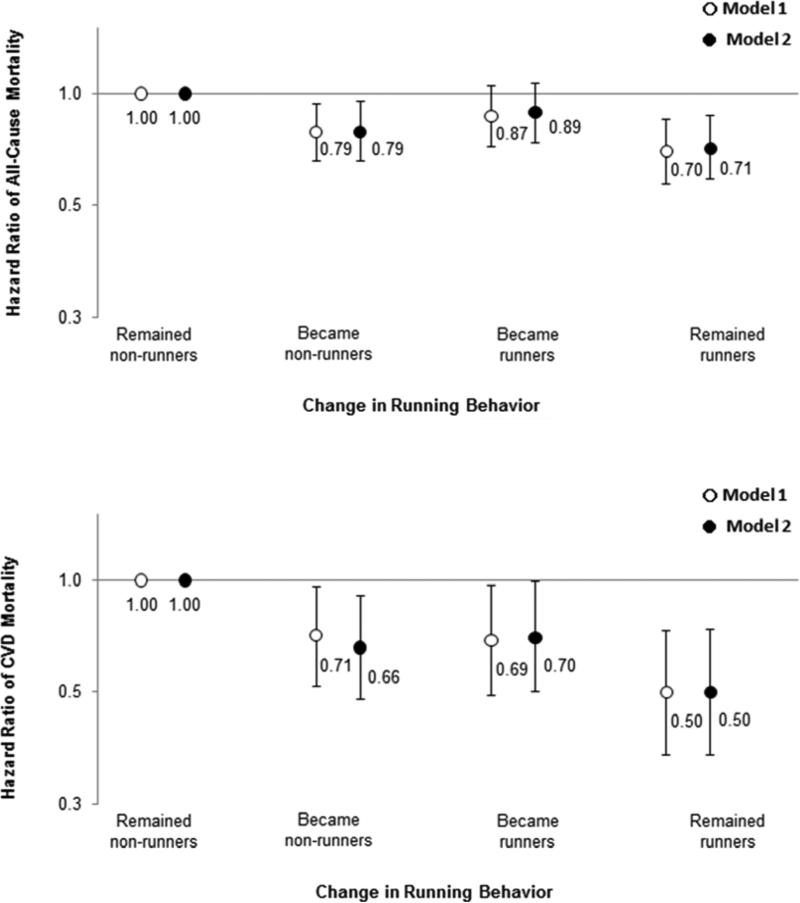
Figure 3. Hazard Ratios of All-Cause and Cardiovascular Mortality by Change in Running Behaviors.
Model 1 was adjusted for baseline age (years), sex, examination year, and interval between the baseline and last examinations (years). Model 2 was adjusted for Model 1 plus baseline smoking status (never, former, or current), alcohol consumption (heavy drinker or not), other physical activities except running (0, 1-499, or ≥500 MET-minutes per week), and parental CVD (yes or no). The number of participants (deaths) in remained non-runners, became non-runners, became runners, and remained runners were 13,522 (1,013), 2,847 (141), 1,578 (131), and 2,700 (113) for all-cause mortality, and 12,885 (376), 2,753 (47), 1,485 (38), and 2,616 (29) for cardiovascular mortality, respectively. The bars indicate 95% confidence intervals and hazard ratios are shown next to the bars.
CVD=cardiovascular disease.

