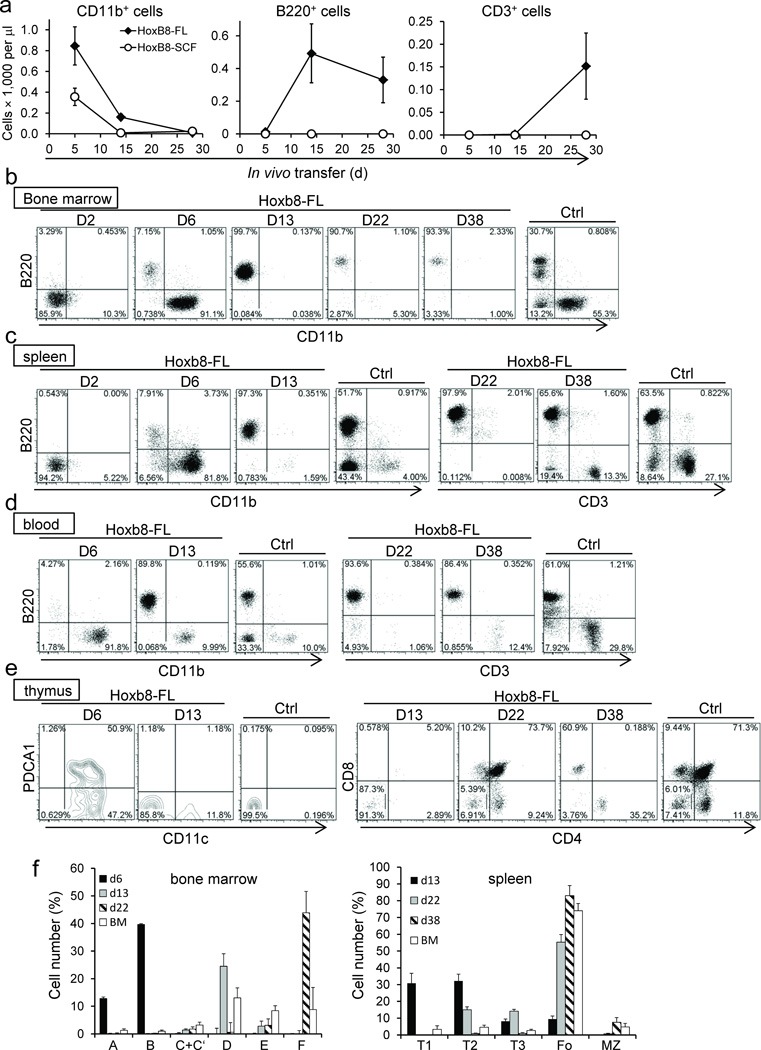
Figure 3. In vivo differentiation of Hoxb8–FL cells.
(a) CD45.1+ Hoxb8–FL– and –Hoxb8–SCF cells were transferred into lethally irradiated CD45.2+ recipient mice and CD11b+, B220+, and CD3+ cells in the peripheral blood were quantified based on flow cytometry and complete blood cell counts. Respective cell populations are depicted as total cell numbers over time. Error bars represent standard deviation of three Hoxb8–FL populations. (b–f) CD45.1+ Hoxb8–FL cells were transferred into lethally irradiated CD45.2+ recipient mice and cells from BM (b), spleen (c), peripheral blood (d) and thymus (e) were analyzed by flow cytometry. Representative data obtained from six mice transferred with two independent Hoxb8–FL cell populations (three mice each per population) per time point are depicted. Tissue from untreated control mice (Ctrl) was used for comparison. Relative numbers of cells of the B–cell lineage in the BM and spleen were determined by flow cytometry as described in Supplementary Figure 8a,b (f). Error bars for Hoxb8–FL–derived cells represent standard deviation of six mice that were transferred with two populations of Hoxb8–FL cells (three mice each). Error bars of untreated mice represent standard deviation (n=6).

