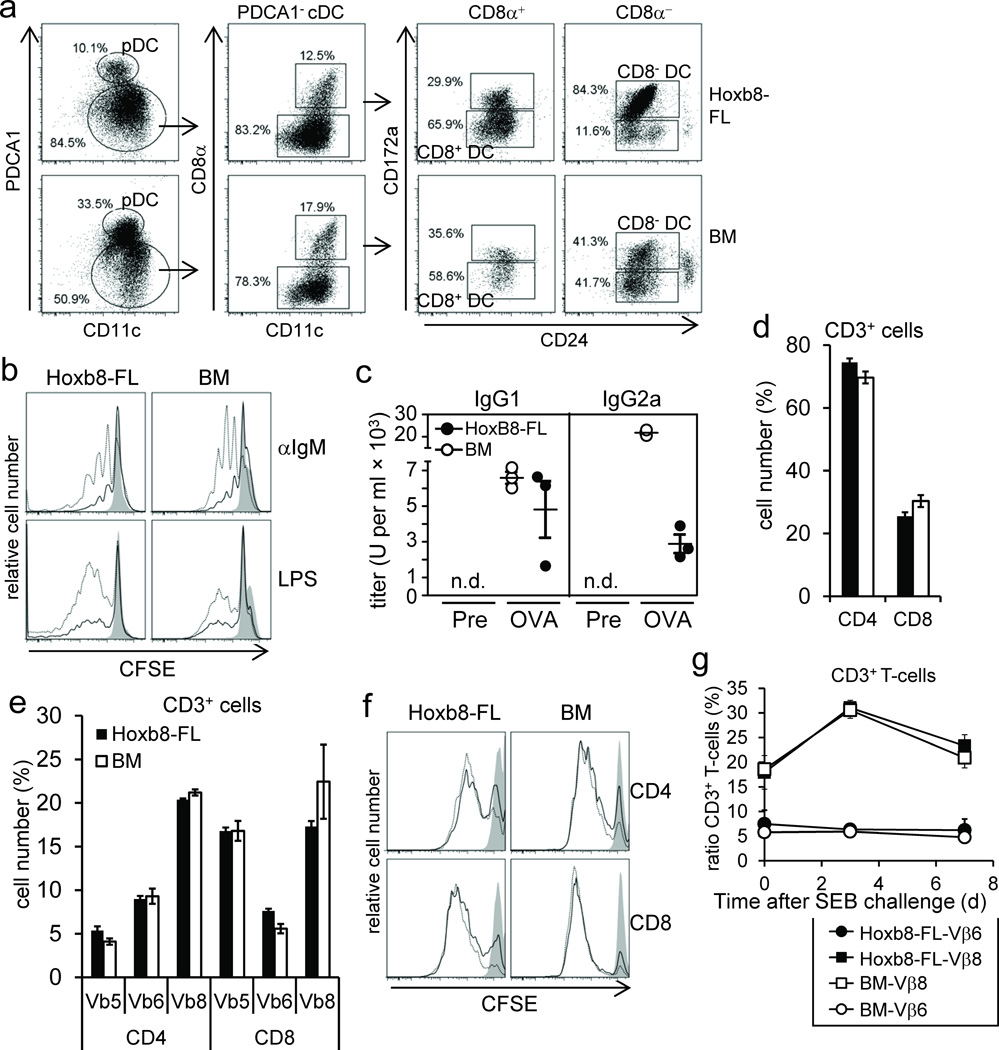
Figure 4. In vivo cell differentiation and function of Hoxb8–FL–derived lymphocytes.
(a) Hoxb8–FL cells or BM cells were transferred into lethally irradiated mice and splenic DC were analyzed by flow cytometry after seven days. (b) Hoxb8–FL cells and unfractionated BM cells were transferred into lethally irradiated mice. Seven weeks later, splenocytes were CFSE labeled and left untreated (filled) or stimulated for three days with anti–IgM antibodies (1 µg/ml (solid line), 10 µg/ml (dashed line)) or LPS (0.1 µg/ml (solid line), 0.5 µg/ml (dashed line), followed by flow cytometry analysis. (c) Hoxb8–FL cells or unfractionated BM cells were transferred into lethally irradiated µMT mice along with unfractionated BM helper cells from µMT mice, followed by intradermal injection of OVA plus CpG–DNA on day 21, 31 and 41 after transfer. Serum IgG1 and IgG2a antibody titers were determined by ELISA one day before immunization (Pre) and 10 days after the last immunization (OVA). n.d., not detectable. (d,e) Hoxb8–FL cells and BM cells were transferred into lethally irradiated mice. Seven weeks later, the percentage of CD3+CD4+ and CD3+CD8+ splenocytes (d), and the distribution of select TCR Vβ chains on CD3+CD4+ and CD3+CD8+ splenocytes (e) were analyzed by flow cytometry. Error bars represent standard deviation of three Hoxb8–FL populations. (f) Splenocytes described in (d,e) were CFSE labeled, stimulated for two days with plate–bound αCD3 antibodies (10 µg/ml: dashed line; 3 µ/ml: solid line; non–stim: filled) and αCD28 antibodies (10 µg/ml) and analyzed by flow cytometry. (g) CD45.1+ Hoxb8–FL cells and CD45.2+ BM cells were transferred into lethally irradiated mice. Five weeks later mice were challenged with SEB and the percentage of CD45.1+ CD3+T–cells and CD45.2+ CD3+ T–cells expressing TCR Vβ6– and TCR Vβ8–chains in the peripheral blood was determined by flow cytometry before and 3 and 7 days after SEB challenge. Mean and standard deviation of four mice are shown.

