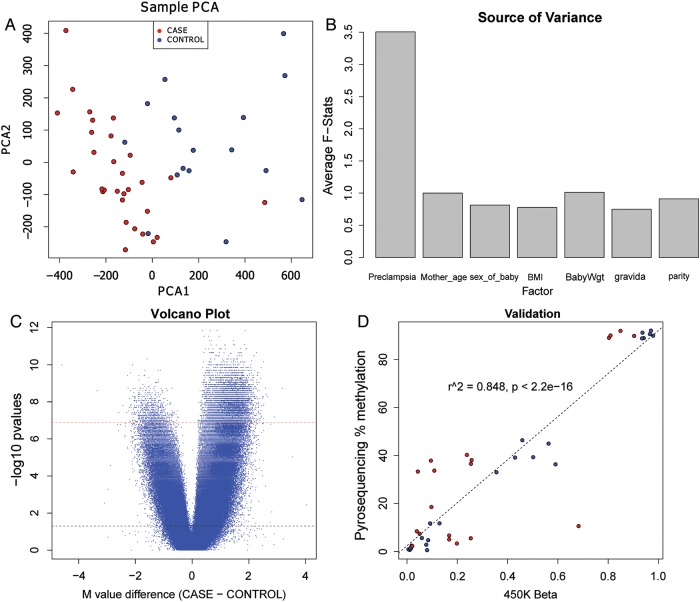
Figure 1.
Global CpG hypermethylation is associated with pre-eclampsia. (A) Principle component analysis (PCA) plot representing differences between pre-eclamptic versus non-pre-eclamptic placentas. The PCA was based on the distance matrix of the methylation intensity values of all samples, measured by the Illumina Human Methylation450 BeadChip. The pre-eclamptic placenta cases are labeled as red and the controls are labeled as blue. The horizontal scale is the first principal component (PCA1) and the vertical scale is the second principal component (PCA2). (B) Source of variance plot of clinical factors using the methylation M values in all chorioamniotic membrane samples. Marginal F-stats were taken from a linear regression ANOVA model comprising pre-eclampsia, age of the mother (Mother_age), sex of the baby (Sex_of_baby), BMI of the mother (BMI) and weight of the baby at birth (BabyWgt) as independent factors. The F-stats were averaged over all CpG sites. (C) Volcano plot of the probes in the Illumina Human Methylation4 50 BeadChip. The x-axis is the average M value difference between the cases and controls. The y-axis is the negative log of the P-values, using the Wilcoxon rank test. The dashed black line represents the α threshold for a significance of 0.05 before Bonferroni correction and the dashed red line is the significance of 0.05 after Bonferroni correction. (D) Pyrosequencing validation results on four selected CpG sites. Y-axis: averaged percentage of methylation per sample in pyrosequencing. X-axis: averaged beta values per sample from Illumina 450K methylation array.

