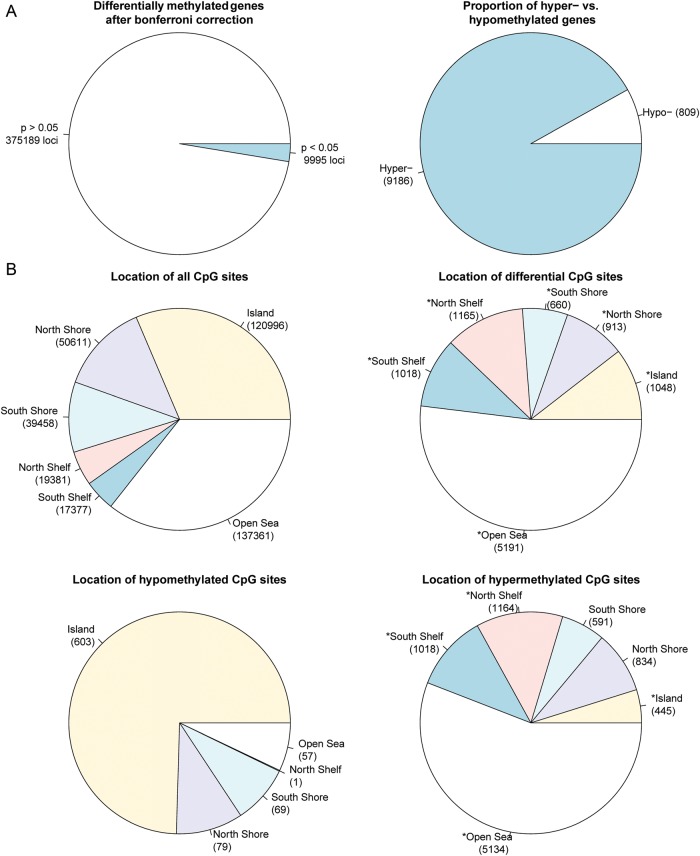
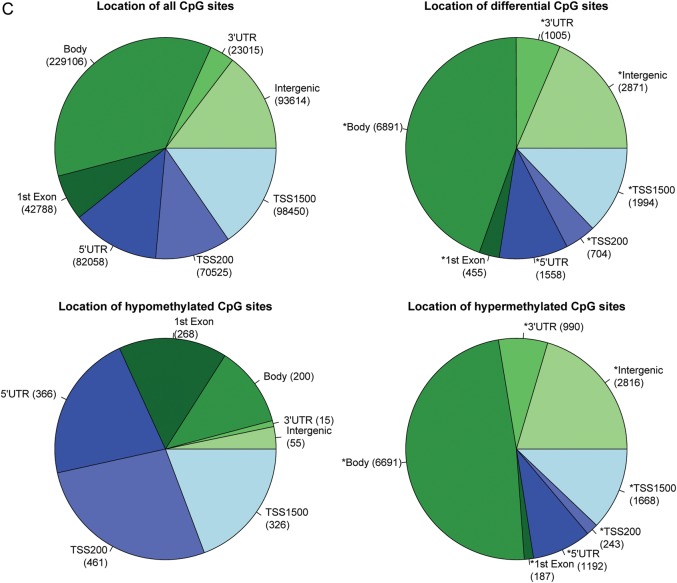
Figure 2.
Comparison of CpG site methylation between pre-eclamptic and normal full-term chorioamniotic membranes. (A) The number of significant versus non-significant CpG sites using Wilcoxon ranked test after Bonferroni correction (left) and the overall distribution of hyper- versus hypomethylated sites (right). (B) CpG site distribution by location relative to genes. Distribution of all CpG sites on the Illumina Human Methylation 450 BeadChip array (top left), distribution of all DM CpG sites (top right), distribution of hypomethylated CpG sites (bottom left) and distribution of hypermethylated CpG sites (bottom right). (C) CpG site distribution by location relative to CpG islands and nearby regions. Distribution of all CpG sites on the Illumina Human Methylation 450 BeadChip array (top left), distribution of DM CpG sites (top right), distribution of hypomethylated CpG sites (bottom left) and distribution of hypermethylated CpG sites (bottom right). P-values for differences in the categorical proportions between differential CpG sites and expected background (all CpG sites) were calculated with χ2 tests, and labeled with asterisks for the significance level of P < 0.001. P-values for differences in categorical proportions between hypomethylation and hypermethylation were calculated and labeled in the same way.


