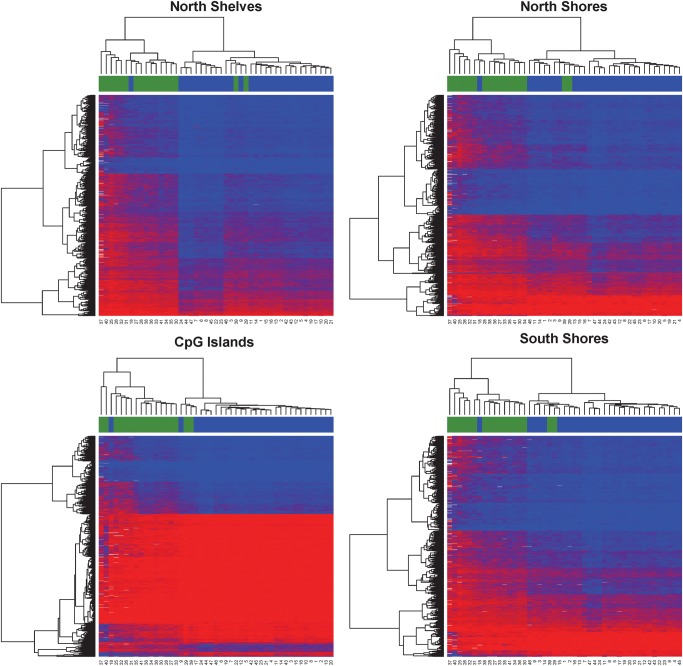
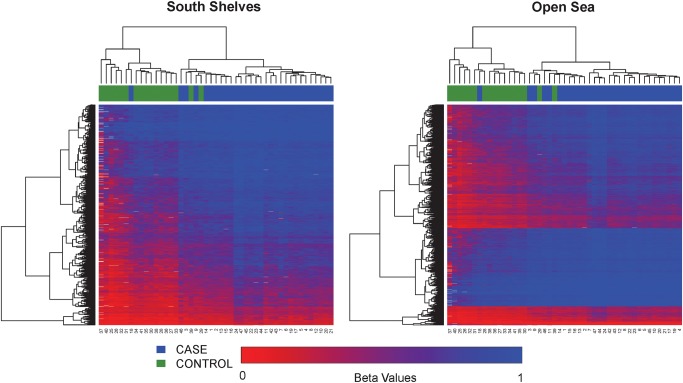
Figure 3.
Heatmaps based on the relative position of significant CpG sites to CpG islands (north shelves, north shores, within CpG islands, south shores, south shelves and open seas). The color scale is based on methylation fraction beta values varying from 0 (red) to 1 (blue). The placenta samples are labeled by pre-eclampsia cases (blue) and controls (green). Both CpG sites (rows) and samples (columns) are ordered per unsupervised hierarchical clustering.


