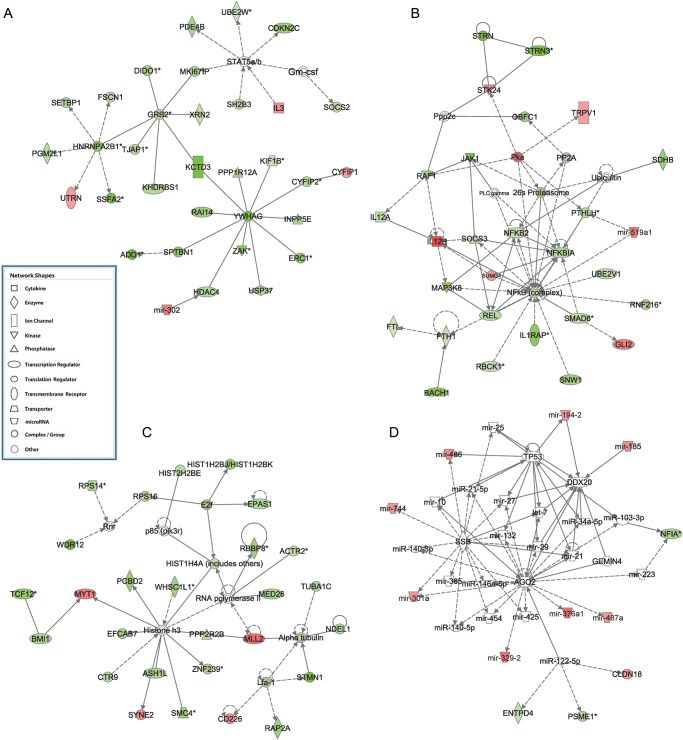
Figure 5.
Top networks in IPA analysis. (A) Network of ‘cancer, cell morphology, cell-to-cell signaling and interaction’. (B) Network of ‘cell death and survival, inflammatory response, cellular development’. (C) Network of ‘cell cycle, embryonic development, cellular assembly and organization’. (D) Network of ‘hereditary disorder, skeletal and muscular disorders, connective tissue disorders’. Red and green colors represent hypermethylation and hypomethylation in the promoter of the gene, respectively.

