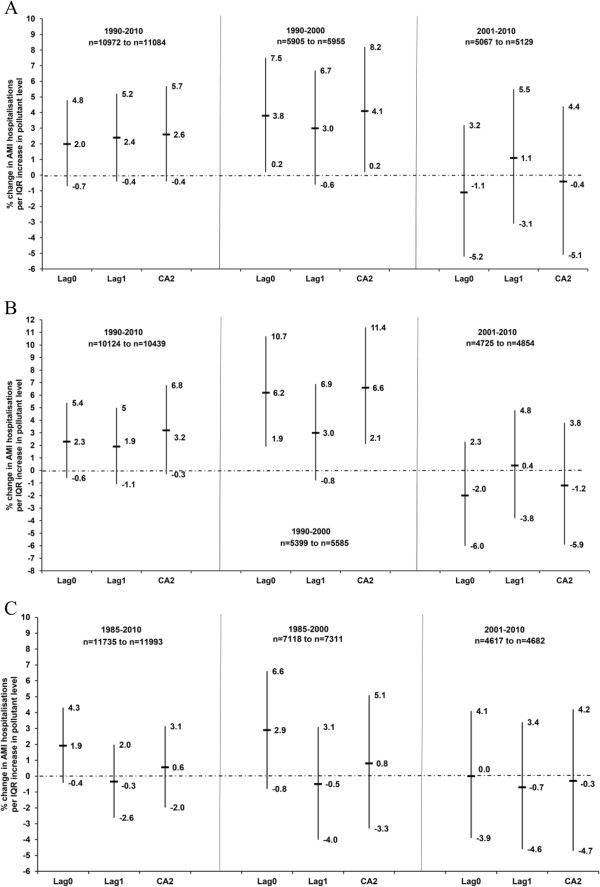
Figure 2.

Association between the lag0, lag1 and the 2-day cumulative average of (A) PM10 in the cold period (October − March), (B) PMrest in the cold period (October − March) and (C) sulphate ion in the warm period (April − September) and acute myocardial infarction hospitalisations in Gothenburg, Sweden (1985(1990*) − 2010) as percentage change in risk (%) and 95% confidence intervals. Models adjusted for temperature, relative humidity and public holidays. Number of cases (n) used in the models is less than the original number due to missing exposure data. *PM10 and PMrest data from 1990.
