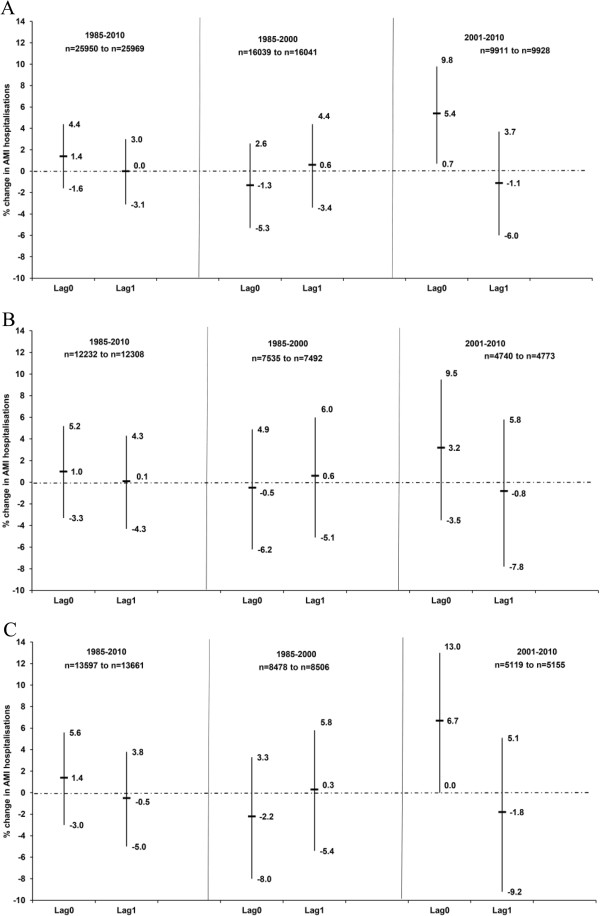
Figure 4.

Association between the lag0 and lag1 of days with limited local dispersion compared to effective local dispersion and acute myocardial infarction hospitalisations in Gothenburg, Sweden (1985–2010) as percentage change in risk (%) and 95% confidence intervals during the (A) entire year, (B) warm period (April − September) and (C) cold period (October − March). Models adjusted for temperature, relative humidity and public holidays. Number of cases (n) used in the models is less than the original number due to missing temperature and relative humidity data.
