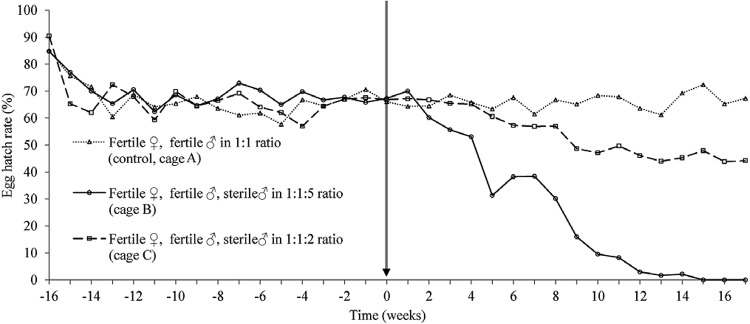
Fig. 2. : hatch rate of Aedes aegypti in treatment and control cages. Stable hatch rate was achieved in each of the three cages during a pre-treatment phase. Vertical arrow represents the start of the release of thiotepa-treated mosquitoes into the cages B and C.