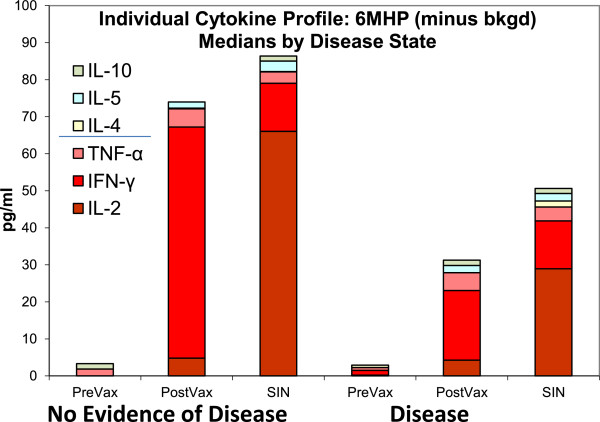
Figure 3.

Individual Cytokine Profiles; Medians by disease state. Cytokine responses are compared by disease state where NED indicates no evidence of disease. Disease indicates unresectable metastatic melanoma. Median cytokine production is shown as stacked bars. SIN were collected at day 22. This is a 2-day culture assay where n = 23. All values are background corrected. Post-vaccine indicates the time point with highest magnitude of response and may differ for individual patients. This figure is shown to display relative proportions of individual cytokines, specifically the relative contribution of IL-2. There is no statistical difference between disease status groups overall.
