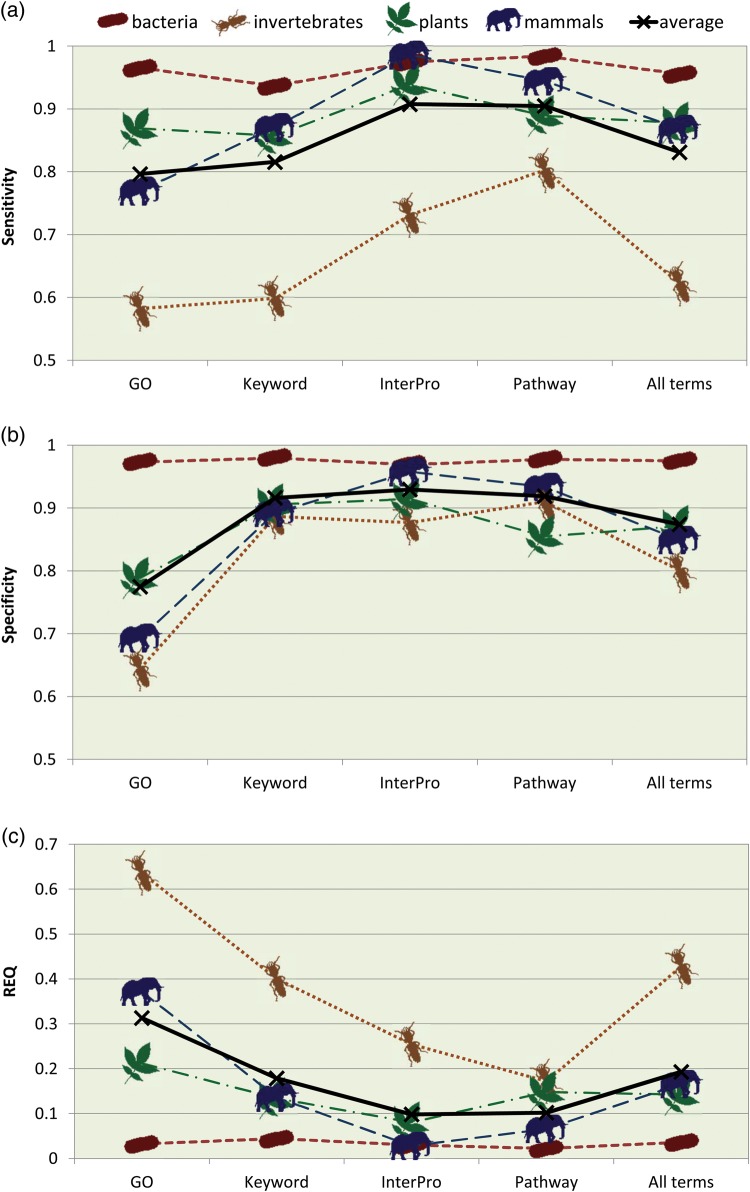
Figure 3.
Sensitivity, specificity and REQ index for different annotation types. (a) Sensitivity, (b) specificity and (c) REQ index calculated from the results obtained by Sma3s with the random datasets from different taxonomic divisions are shown, separated by the different annotation types under study. This figure appears in colour in the online version of DNA Research.

