
Figure 4.
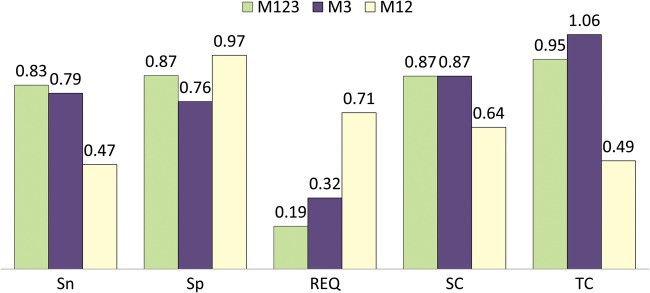
Comparison of Sma3s performance using all modules (M123) or the M3 module alone. Corresponding sensitivity (Sn), specificity (Sp), sequence coverage (SC) and term coverage (TC) values appear above the bars. This figure appears in colour in the online version of DNA Research.